


Predictive analytics in Alteryx allows us to build workflows that make predictions about future outcomes using historical data and statistical modelling. These outcomes can then be used to categorise data, identify potential trends and areas of focus.
There are multiple modelling tools available in Alteryx, each one uses a different statistical modelling method. Information on each model can be found by clicking on the tool within Alteryx. Below are some examples of the tools I've used so far.
- Use Boosted Model to create generalized boosted regression models based on Gradient Boosting methods. The models are created by serially adding simple decision tree models to a model ensemble to minimize an appropriate loss function.
- Use Count Regression to create a regression model that relates a positive integer value (for example, the number of visits a customer makes to a store) and a target variable (for example, money spent) to 1 or more fields that are expected to have an influence on the target variable (for example, gender/age).
The Poisson regression model makes a strong assumption about the relationship between the mean and variance of the target field
The Quasi-Poisson model allows for a variance that is different from the mean.
- The Forest Model tool creates a model that constructs a set of decision tree models to predict a target variable based on one or more predictor variables. The different models are constructed using random samples of the original data
- The Linear Regression tool creates a simple model to estimate values, or evaluate relationships between variables based on a linear relationship.
- The Logistic Regression tool creates a model that relates a target binary variable (for example, Yes or No) to one or more predictor variables to obtain the estimated probability for each of two possible responses for the target variable
- Use Decision Tree to create a set of if-then split rules to optimize model creation criteria based on Decision Tree Learning methods. Rule formation is based on the target field type: If the target field is a member of a category set, a classification tree is constructed however, if the target field is a continuous variable, a regression tree is constructed
A Model Comparison tool can be used to compare the accuracy of the models produced, the chosen model can then be used to predict responses for the target variable.
Building your Workflow
What is your Target Variable?
This is the field that you want to predict. This could be a binary (Boolean) outcome such as whether or not a customer is likely to return to your store, a numerical value such as average life expectancy for a smoker, or categorial such as species of plant or animal. In this example, we will be estimating the quality of a wine based off multiple predictive variables.
Some Basic Data Prep
It is likely that your data will be brought into Alteryx in string format which is not compatible with most modelling tools. This can be manually changed using a Select tool, however depending on the number of fields this is not always best practice. An Auto Field tool can be used to change the data type of all fields based off what Alteryx believes to be the best fit. Any incorrect changes can then be rectified using a Select tool afterwards.

Sample your Data
It is not always possible to use your entire data set to build the model. Modelling tools take a long time to run and so sometimes it is more beneficial to use a Random Sample tool to limit the number of records coming through the workflow.
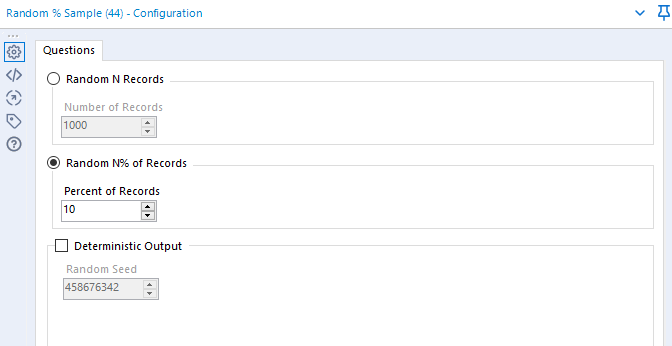
This can be done by selecting a random percentage or number of records. The recommended sample size is 10% or 1000 records. A sample size of 1000 is still sufficient to model on a 200,000 population. It is a matter of judgement.
Estimation and Validation Samples
This is the data that will be passed through your model. The Create Samples tool can be used to split your data into two. The Estimation Sample will be passed through your model and the Validation Sample will be used to predict the accuracy of the models by comparing the output to the pre-existing data.
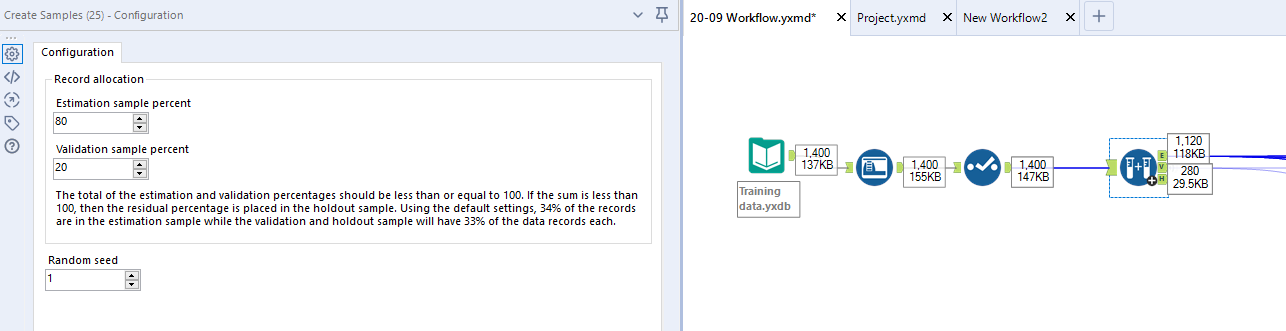
I generally use the default 80/20 split, however this can also be edited to enhance running time. Your sample sizes do not need to add up to 100 but must not exceed it however it should be noted that under sampling could produce inaccurate predictions.
Select your Models
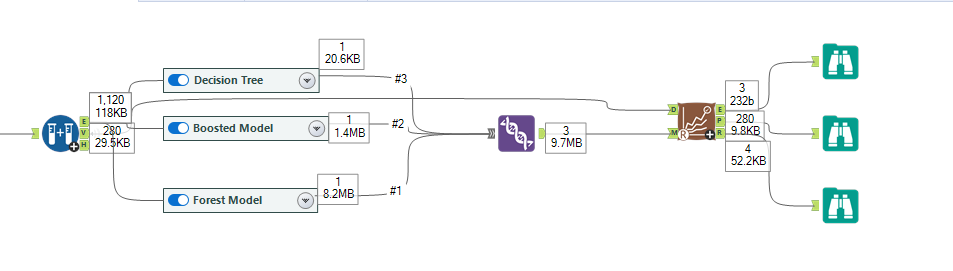
Choose 2-4 models that you believe best suit your data and connect to the E anchor on your Create Samples tool. In this example, I have used Decision Tree, Boosted Model and Forest Model. Put a Browse tool on each of your outputs, this will slow down the workflow but is beneficial to view the reports generated by the tool. These can be disabled or removed later on.

Configure the Tools
This is where you specify your Target and Predictive variables. Make sure that your Target variable isn't also ticked in the Predictive variable list, this will skew the results of your model.
Run your workflow
This will take a few minutes. If your workflow seems to be running for a disproportionate time it is likely you have made an error configuring one of the tools, go back and check you have correctly specified the data types and sample size. Have a look at the reports generated by each tool (R anchor), there is an assumed level of statistical knowledge in interpreting them but they contain information that may be worth further investigation.
Compare your models
As the Model Comparison tool can only work with a single input you will need to use a Union tool to connect to the O output anchors of your model tools. If your workflow is starting to look a bit messy you can use containers to tidy things up a bit.
Connect the output anchor of your Union to the M anchor of a Model Comparison tool and the V anchor from your Create Samples tool to the D anchor. This is essentially comparing the predictions from your models to the 20% Validation sample you specified earlier and estimating the accuracy of those predictions.
Add Browse tools to all the output anchors and run the workflow.
Choose your model
Use the generated report on the Browse tool to select what you believe to be the most accurate model.
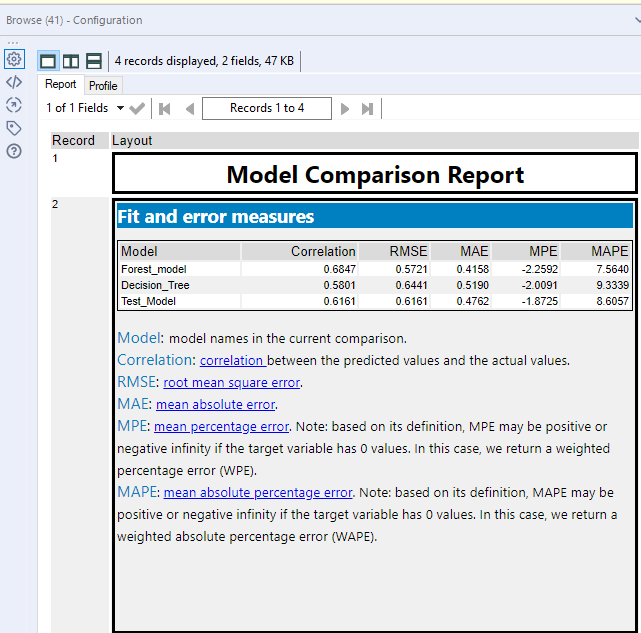
In this report we can see that there is the highest positive correlation between the actual data and the Forest Model. This would suggest that it has the most accurate estimation. The Correlation field in the report can sometimes be replaced with accuracy.
If you are not satisfied with the accuracy of the estimates produced by your models then you can go back and select different model tools, link them to the Model Comparison tool and compare the accuracy again.
Score your Model
Use an input tool to bring in the data you want to run through your model. In this case I have a list of wines that have not been categorised by quality.
Bring in a Score tool and connect the D input anchor to that input tool and the M input anchor to your chosen model, in this case it is the Forest Model.
Run the workflow. This will append a 'Score' field to your original data set, this is your Target variable estimation. This can be renamed in the tool configuration. I have left the other settings at default.
As this data does not contain a brand name, I have added a Record ID tool to help identify the wines.

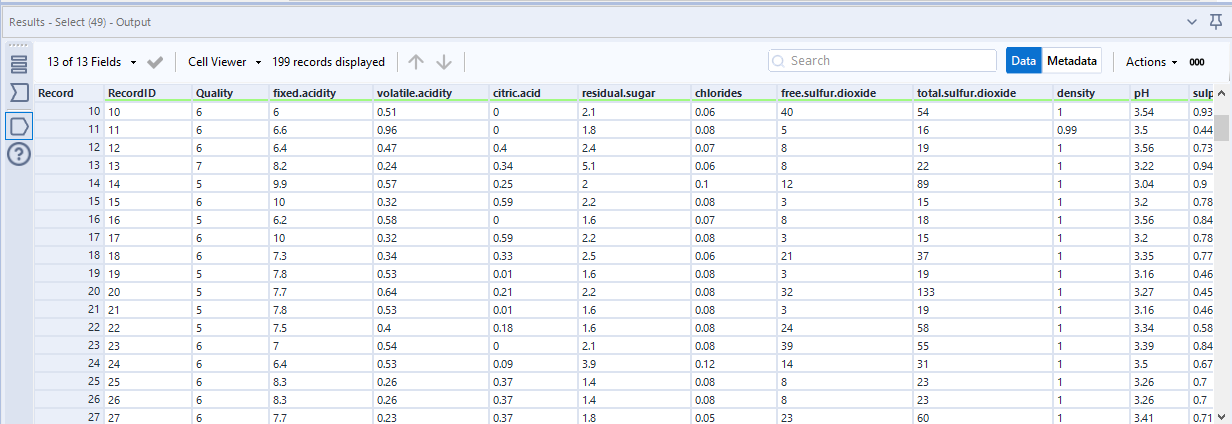
Depending on your desired output, you can then use a Select tool to tidy up your data. As Quality is an integer I have used a select tool to change the data type and bring the field to sit beside the Record ID.

In the Select output we can now see the original list of wines with the additional Quality field.
If you only needed the list of wines and their quality, the other fields can also be removed using the Select tool.
Output your Data
Connect an output tool to your data to export your predicted results. Depending on your requirements you can then use this output in further Alteryx workflows, or import into Tableau for visualisation.
This blog only covers the fundamentals of modelling in Alteryx. Estimations become more complicated with larger datasets with excess fields that need to be removed, especially if those fields don't have an immediately apparent meaning or relevance. However, workflows such as this can be used in conjunction with other Alteryx tools to predict an outcome.