


On day 9 at the Data School we were introduced to parameters in Tableau and their different uses. It was a bit of a face-palm moment for me as I realised how much I’d over-complicated them in my application vizzes!
A parameter is a function which allows a level of customization to be added to graphs, charts and dashboards. Parameters are dynamic and replace constant values in calculations, filters and analytics. A parameter, however, cannot function without having a calculation which tells it what to effect/change.
Creating a Sliding Range Parameter:
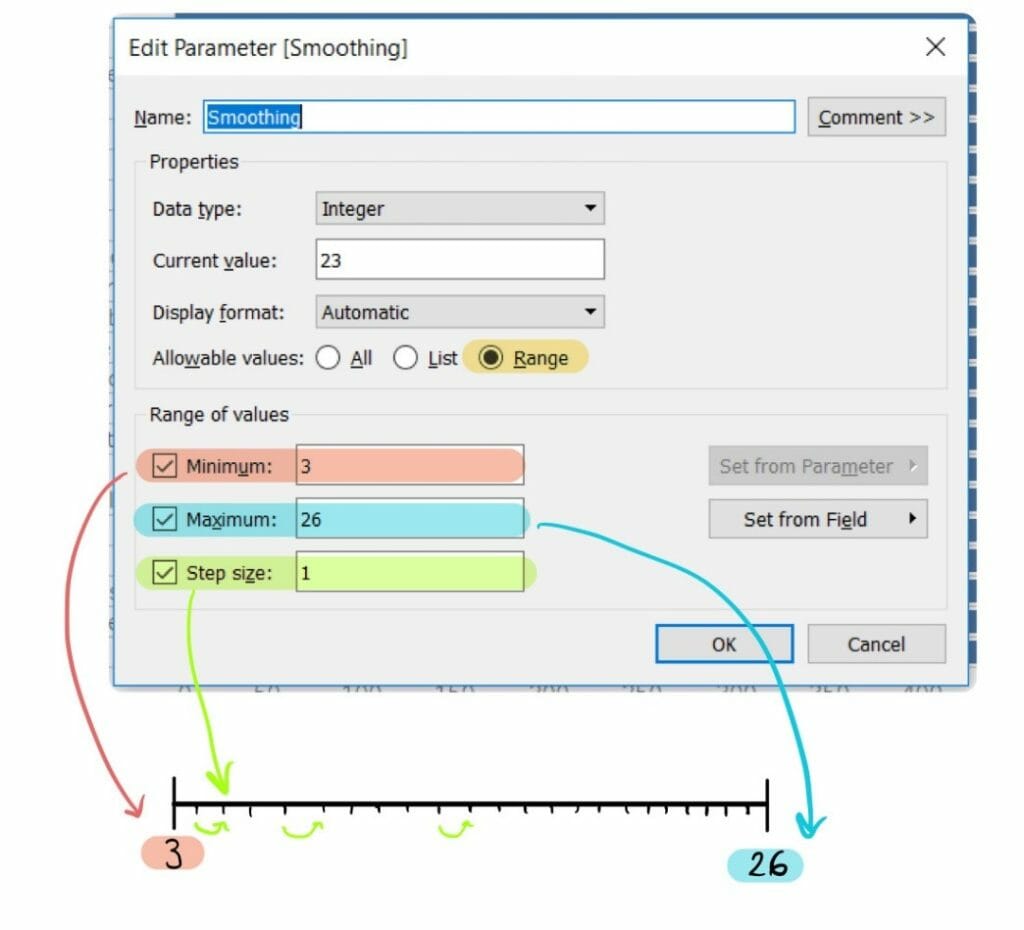
First go to ‘create a parameter’ and assign an appropriate name to it.
Next select ‘Range’ in the ‘Allowable Values’ option. Make sure to select the correct data type, in this instance it was an integer.
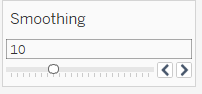
Choose the minimum and maximum values you want the user to be able to choose from and then the ‘Step Size’ (interval size) for the range. Select ‘OK’ and then ‘show parameter control’ in your worksheet.
Next we need to ‘create a calculated field’ to tell Tableau how to use the parameter. In this example we want to use the parameter to show the Top N Players. To do this we drag the dimension we want to filter by, player ID in this example, to the filters card.
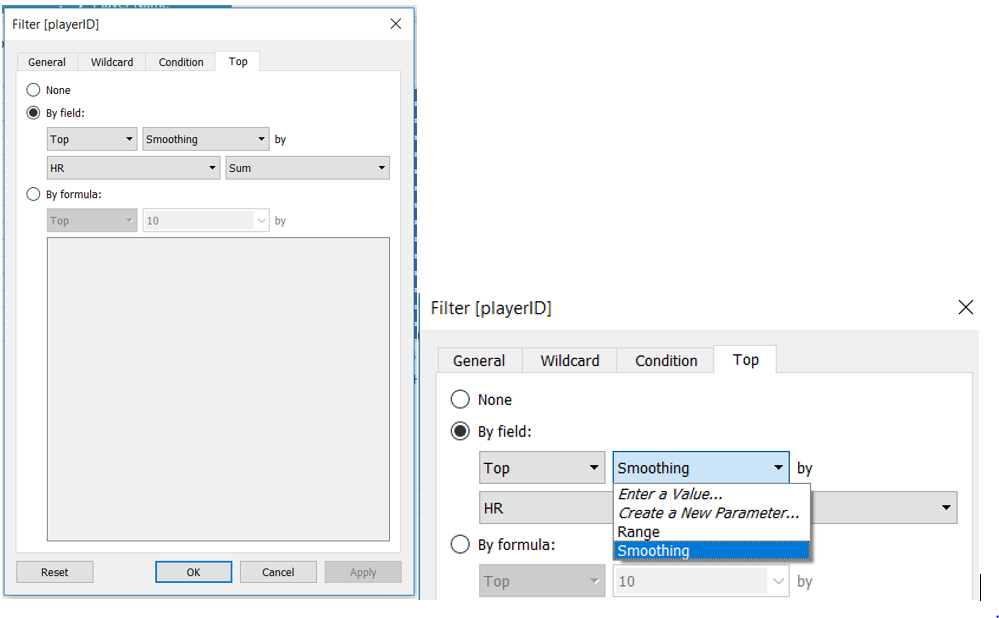
To tell the filter to work by the parameter select the parameter in the ‘by field’ option. Now, when altered your parameter will change your graph to show the top N players.
Creating a List Parameter:
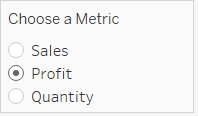
Again ‘create a parameter’ and provide an appropriate name. In this example I want my user to be directed to choose an option using this filter, so I have titled the parameter ‘Choose a Metric’.
As these are specific text values to choose from, the data type is ‘String’.
Select ‘List’ from the ‘Allowable Values’ option and below enter the values you want.

Once created ‘show’ parameter control and select to view in a ‘Single Option List’. You should get something like the following:
To tell Tableau what to do with this parameter we need to create a caluclated field.
In this case we want to select the value of the metric we have selected so we will use the CASE formula. This tells Tableau that, for example, when ‘Sales’ is selected in the parameter to show values from the ‘Sales’ field of my data source.
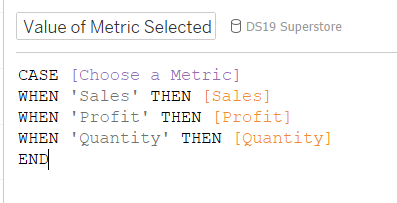
Use this new calculated field as your value and as you change the parameter your graph/chart should change with it.
Using Parameters with the Analytics Tab:
Parameters can be used when creating reference and average lines/bands.
Drag your chosen option from the ‘Analytics’ pane onto your canvas and select ‘edit’ if the preference window doesn’t automatically appear.
In ‘Value’ select your parameter and then customise the appearance of the line/band and its label.
Select ‘OK’ and your line/band should change when you alter the preferences on your parameter.