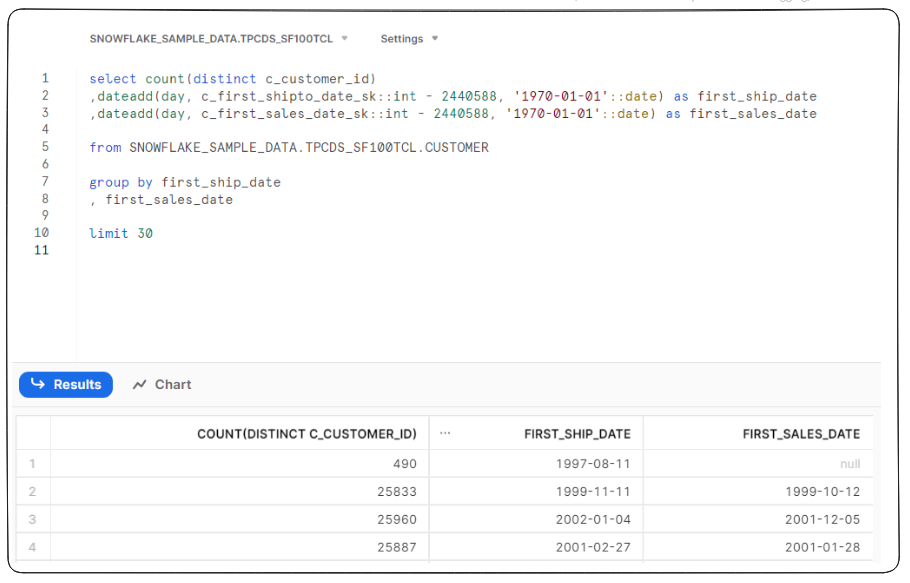
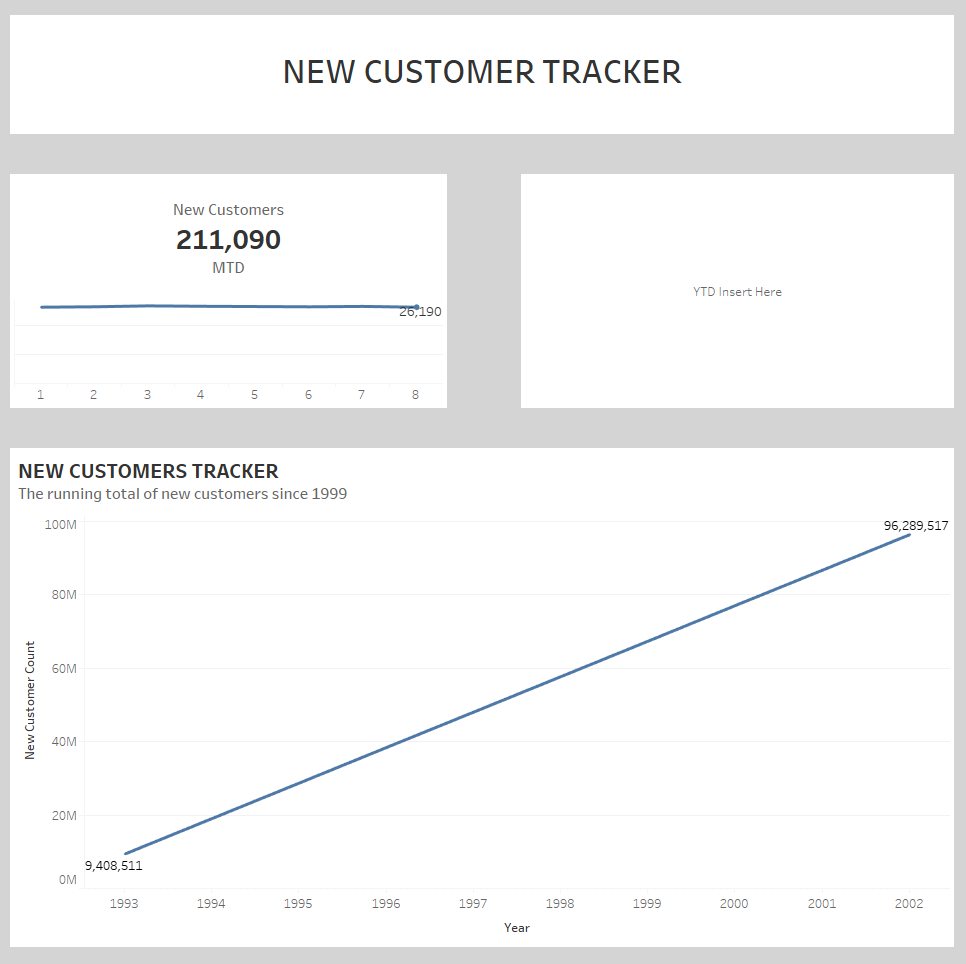
Today’s challenge consisted of writing SQL code in Snowflake, to access data to make a dashboard in Tableau. The catch, it was billions and billions (and billions) of rows worth of data. What’s worse, is that everyone was running queries at the same time, which meant they were timing out or cancelling. Not ideal.
My first (silly) idea was to join the in store sales and returns datasets, and the web sales and returns datasets, so that I could do all of my analysis in Tableau. When you are talking about billions of rows of data, this was going to take too long, so time to pivot.
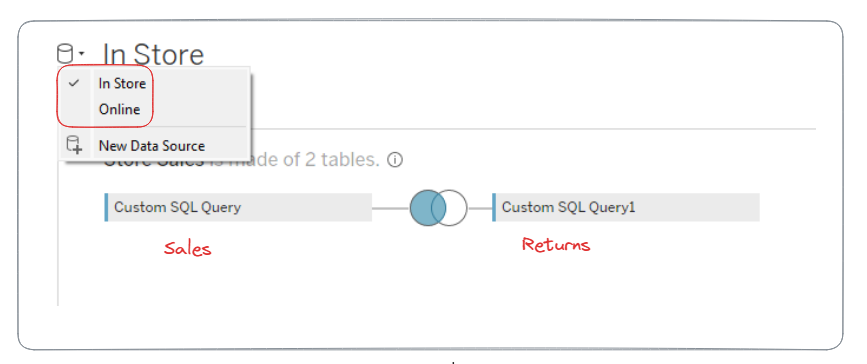
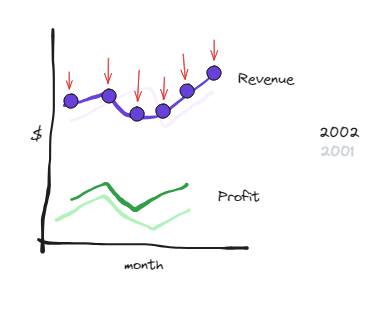
Up next, I thought to aggregate, and only create the ‘points’ on the graph I wanted. In my case, I wanted to compare revenue and profit over time, between the two revenue streams (in store vs online).
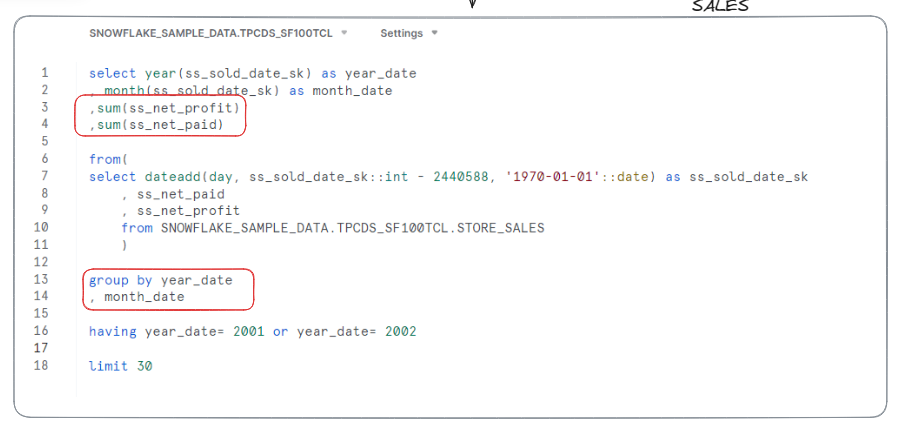
Despite writing the query, after I attempted to make an extract of this new and improved dataset in Tableau, an hour later, it had timed out. Time for plan C.
Between the group, we learnt that ‘counts’ were quick whilst ‘sums’ were slow. So, I made a quick de-tour, and decided to look at the count of new customers’ overtime.
