


The task for the final day of Dashboard week did not require any Data Prep and was based on the History of Powerlifting. We had to complete the task by 1pm and present our dashboards from yesterday and today to DS15.
Here is my viz:
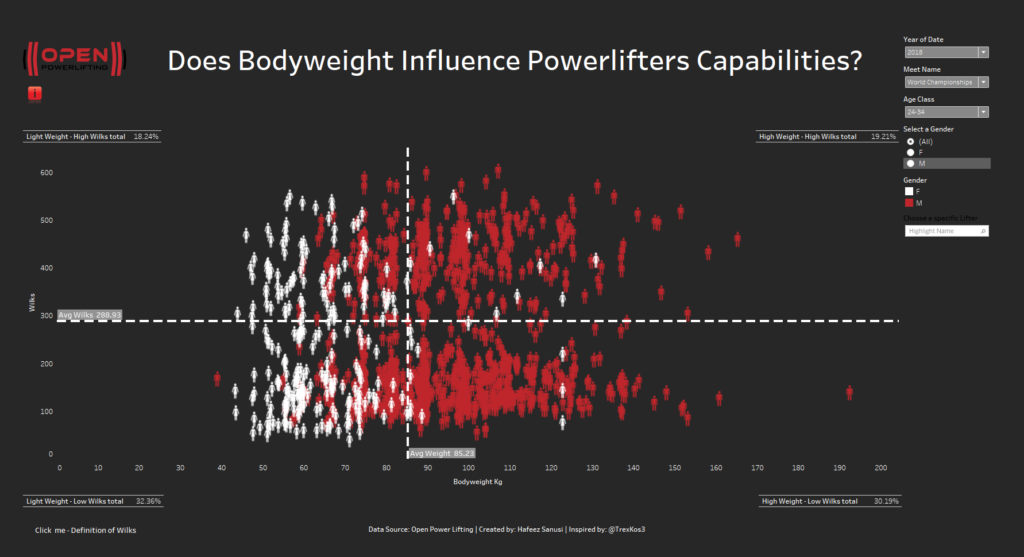
For today’s viz, I wanted to investigate whether the Bodyweight of Powerlifters influenced their lifting capabilities. I used a scatter plot to do this which was inspired by @TrexKos3. The viz has multiple dropdown menus/options (Year/Meet Name/Age/Gender) to allow the user the ability to filter the view. The viz shows the Wilks Coefficient and Bodyweight for each powerlifter (dependent on what is filtered) with further information about their best Bench/Deadlift/Squat scores available in the tooltips.
Here is a link to the viz: https://public.tableau.com/views/DoesBodyweightInfluencePowerliftersCapabilities/DoesBodyweightInfluencePowerliftersCapabilities?:embed=y&:display_count=yes&publish=yes&:origin=viz_share_link
Overall, I am happy that I made it through the week without breaking! There is never a week where you are not learning a multitude of things at The Data School and this week was definitely living proof of that!