


One stage of preparing data before moving it into tableau desktop for analysis and visualization is Pivoting. There are 2 types of pivot that are used: row to column and column to row.
First it is important understand the difference between rows and columns and why it is so significant, that in some cases they need to be swapped in order for tableau to be able to recognize the data as you would like.
Columns are the vertical divisions within a data set. Generally we like this to represent a category of data, with all the entries in this section representing the data that would fall into the same bracket.
Rows are the horizontal divisions within a data set. This represents each record of data. Entries in this section contain data that all represent the same ID.
In general, the dataset needs to be arranged in a way that the rows and columns are as explained earlier. In some cases we may have a dataset that does not follow this format and the pivot function is useful to adjust this.
Below is an example of how we would use the pivot function to make to optimize our data for tableau desktop. This data set currently represents the number of new or existing customers that bought a particular accessory at a bike store on different dates.
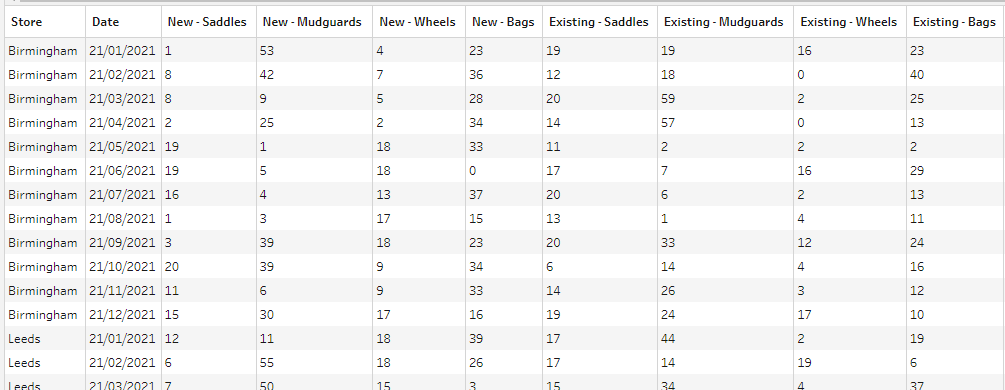
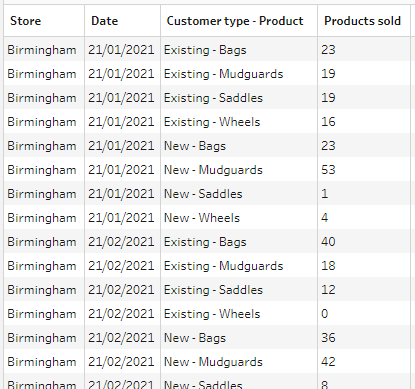
However, we would like the headers to be store, date, customer type and product and products sold. This would involve pivoting the headers that represent a new/existing customer and product sold. Using a columns to row pivot we can make this possible. The software will then aggregate the rest of the data, forming data set that now looks like this:
By cleaning up the data and using other tableau prep techniques such as splitting, removing columns and aggregating. This is the graph that is formed:
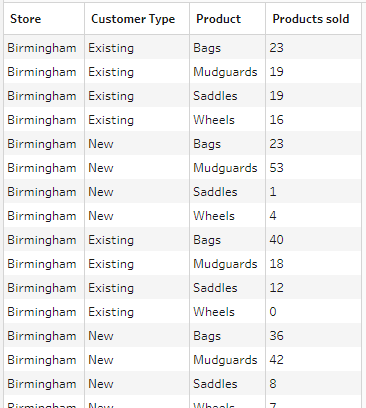
This can now be processed in Tableau desktop a lot more conveniently. The rows and columns now follow the general rule as stated above. With columns being different categories and each row is a record.
This rows to columns pivot can also be used in a similar way for data which which has the opposite problem.