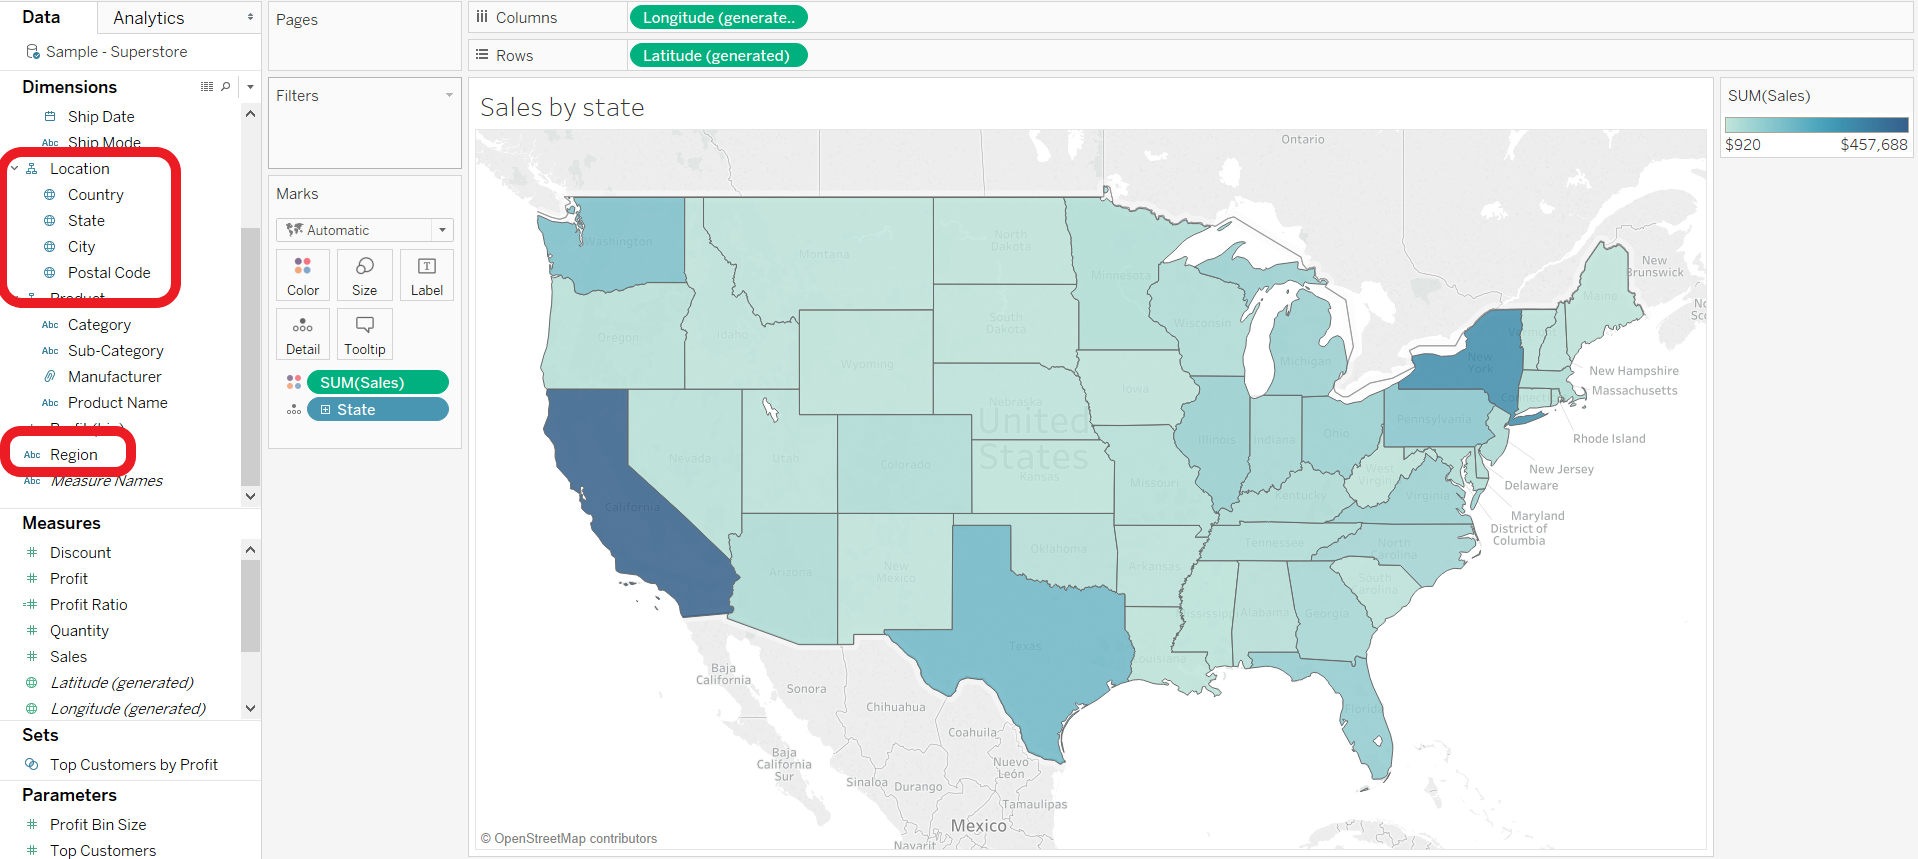
I think it’s fair to say that on the whole Tableau is pretty clever when it comes to geographical dimensions. As long as a dataset is relatively clean, I’ve often found that generating marks on a map is as simple as double-clicking the dimension and watching as Tableau does the rest. In the example below, plotting sales by state was easy because Tableau recognised the geographical data. We can see that it picked this up because of the globes appearing next to the dimensions.

In some cases however, you may have location data that Tableau is unable to recognise because it is dataset specific. In Tableau’s sample superstore dataset, this is the case for the ‘Region’ dimension. On top of Country, State, City and Postal code, each row of data is also labelled as either Central, South, East or West. This category might reflect operational segmentation within the company, for instance into four distinct sales teams. Humans recognise immediately that this category is geographical in nature, however Tableau has no way of knowing how to plot this on the map, identifying the data as a string instead.
We can use the other geographical dimensions in the dataset to convert ‘Region’ to a geographical dimension, allowing us to represent the regions on the map.
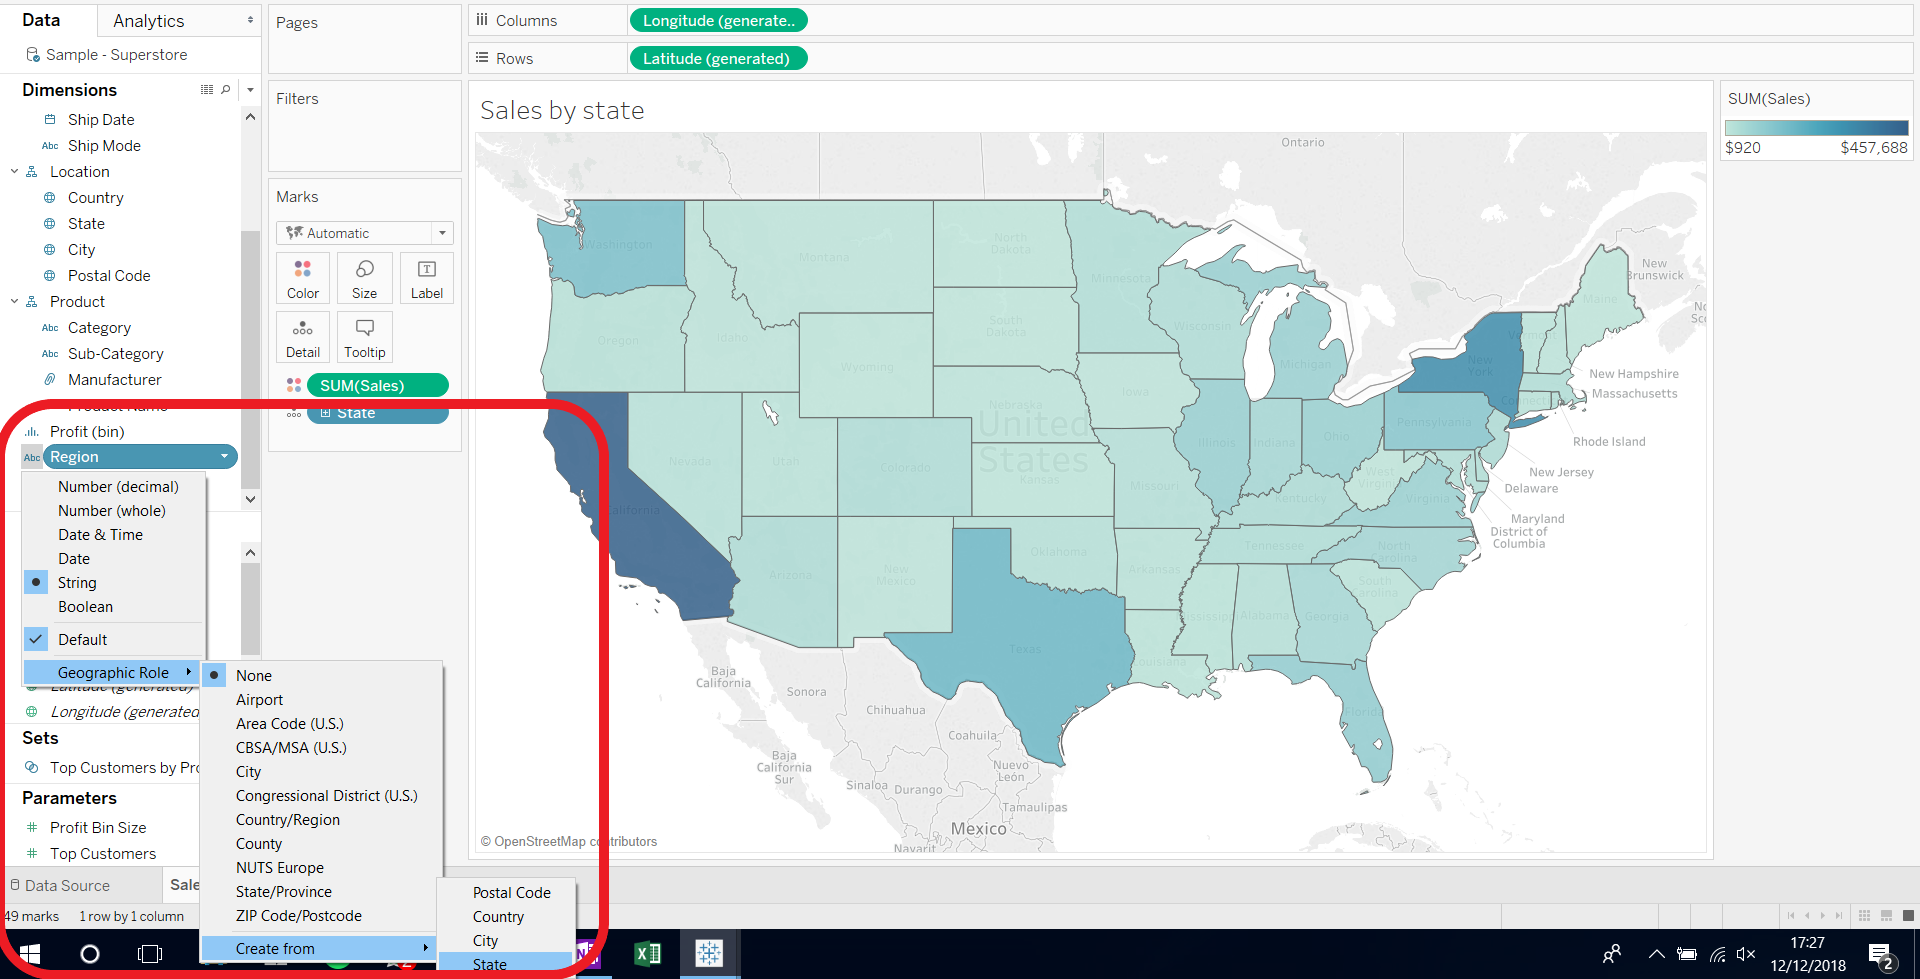
- Click on the data class icon next to ‘Region’ (the ‘Abc’, which denotes that this is currently a string) to determine the geographic role.
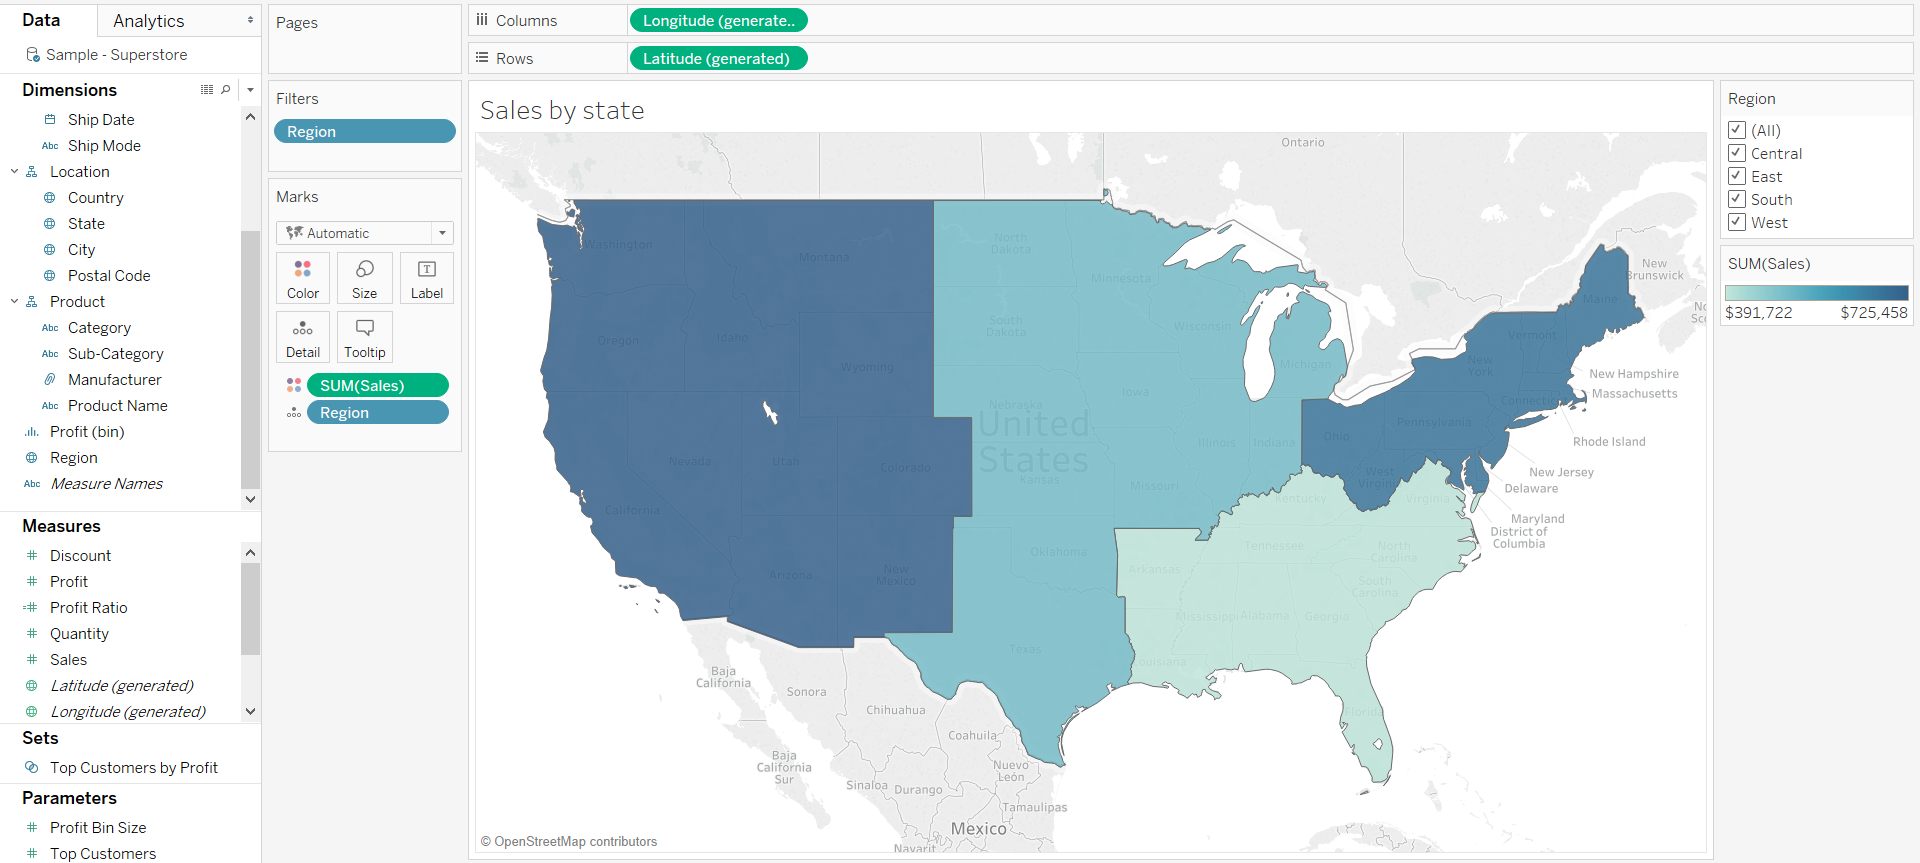
- Since the geographic role has not been recognised by Tableau, we need to specify it. In this particular case, regions match states. In other words, each state is part of a distinct region without any overlap (more on this further down). Select state. Tableau will work out how regions are composed of states – a geographical dimension that is automatically recognised. In the picture below, you can see how states make up a region.


Make sure the dimensions match consistently
Finally, a word of caution. As ever, the key to success is ensuring that the data is set up correctly. In this case, each region needs to be associated with states in a consistent manner to allow Tableau to match states to regions. If a single row were mistakenly labelled, Tableau would identify multiple matches for a given region. A sale in Florida marked as West would lead Tableau to think that Florida is contained within both the West and South regions.
