After shadowing day yesterday at UBS I am back in Data School for my day two on Dashboard Week. The task of the day was to build a dashboard from Google Analytic Data about the Data School Blog.
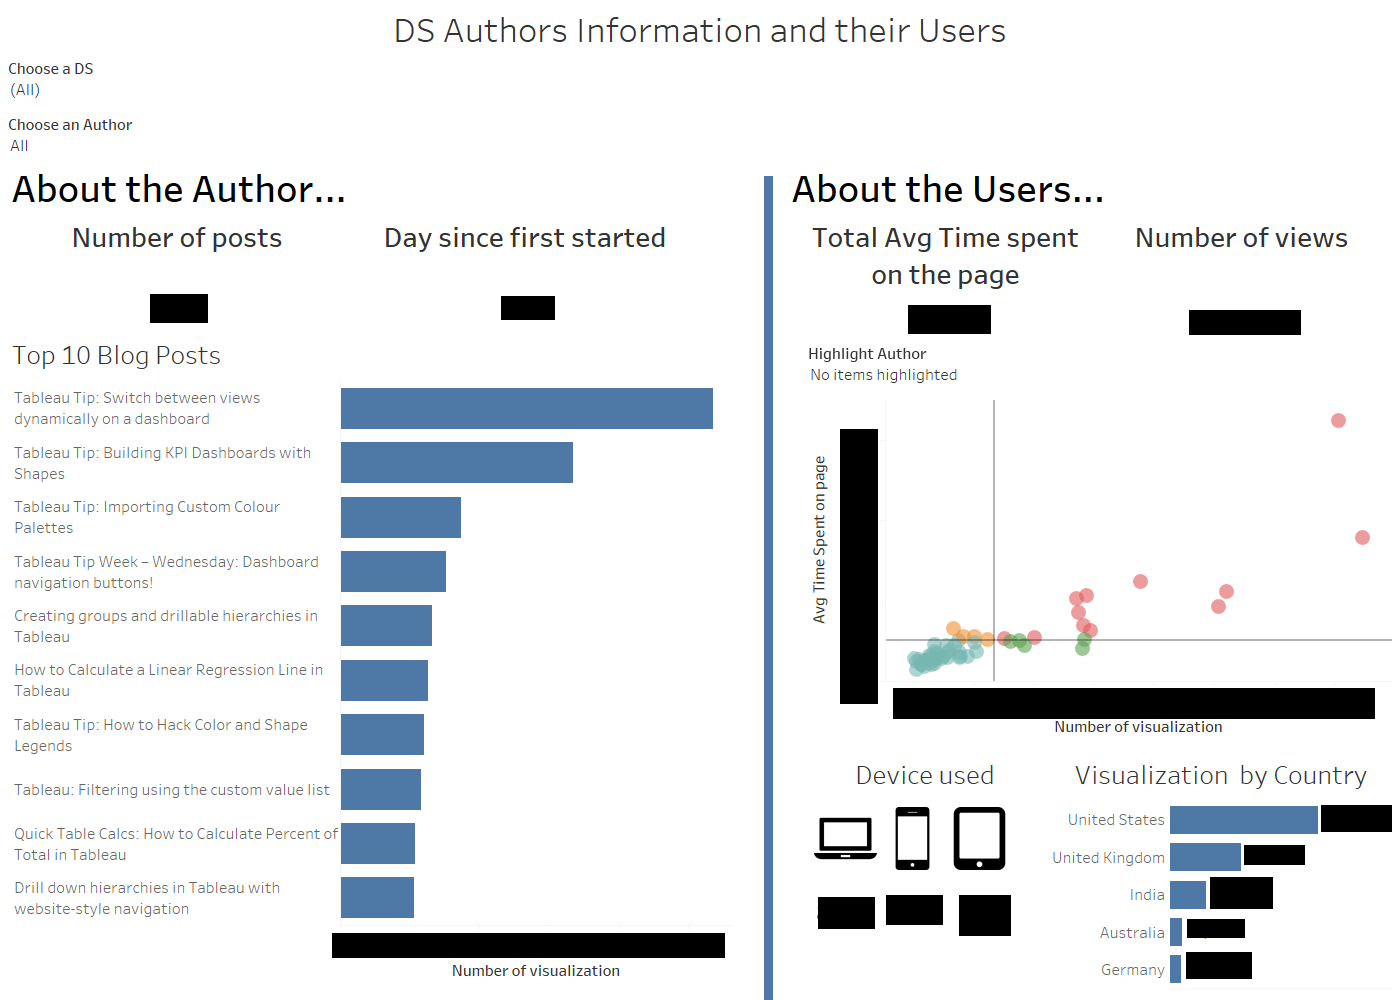
Today I took a very different approach from Monday. After looking at the data I have started sketching straight away what I wanted my dashboard to look like. The aim was to show any sort of information about both a single DS and/or individual authors. I have divided my dashboard into two sections, the first one with information about the Author and the second one with information about the Users.
So this is how my dashboard look like:
Lessons learnt today:
- How to connect and work with Google Analytic Data
- Sketching really helps when visualising the data
- A lot of new information about my co-worker’s blog!