This blog covers how to transform your data in Alteryx using the Transpose and Crosstab tools.
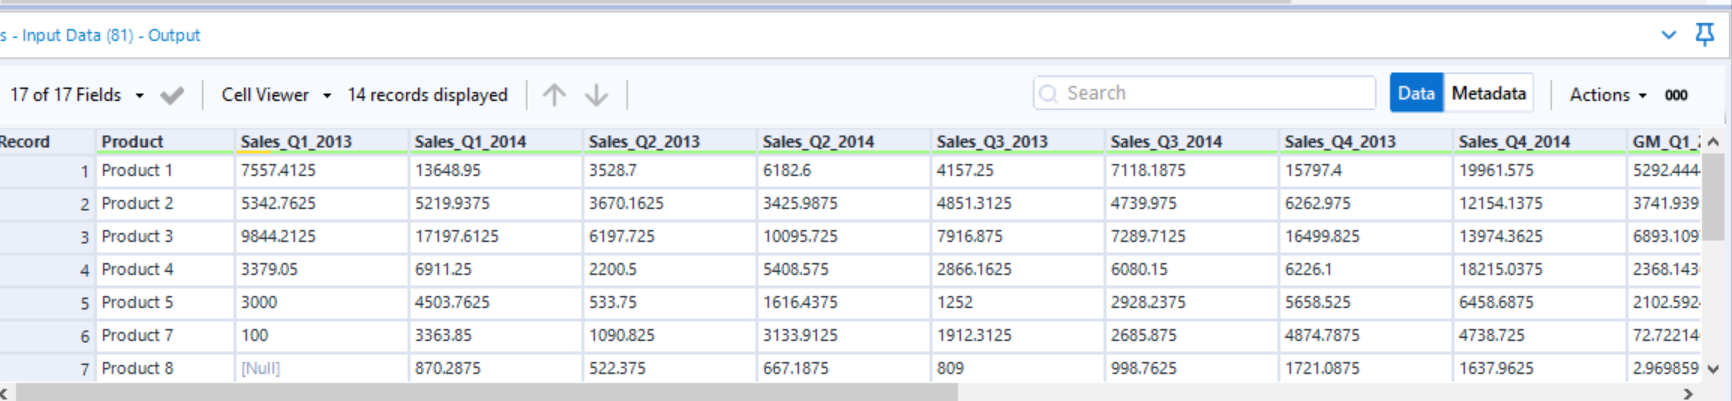
A wide table is often user-friendly but not computer-friendly. An example of this is shown below:
This is where the Transpose tool comes in handy:

When using the Transpose tool, the configuration pane allows you to choose the key columns and the data columns. The key columns select the columns (fields) to pivot the table around. The column heading remains as is on the horizontal axis and each data entry is replicated for the data columns selected. In this workflow the Product was selected as the key column and all columns with 'Sales' or 'GM' as prefix were selected as the data columns to be pivoted.
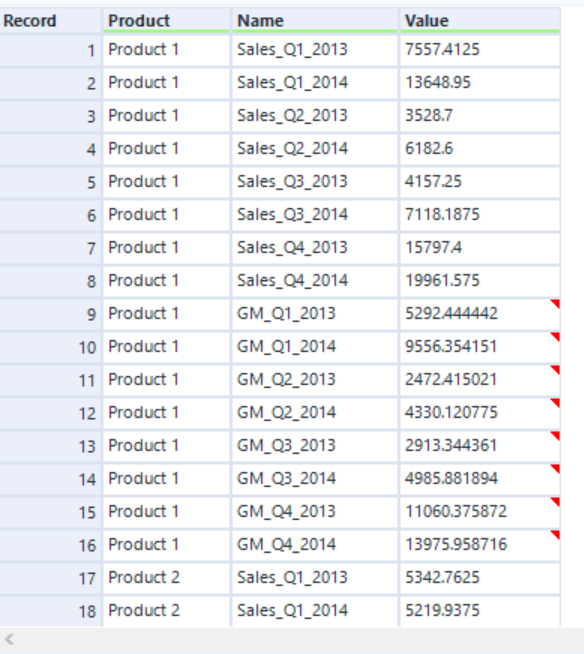
The Name column can be separated into three separate columns for the Measure, Quarter and Year using the Text to Columns tool:

In the configuration pane, the delimiter is set to '_' and the number of columns is set to be split into three. Now since the Measure has been separated into 'Sales' and 'GM' the data can be transformed from one Measure column containing both Measures to two individual columns for each Measure. This is executed using the Transpose tool:

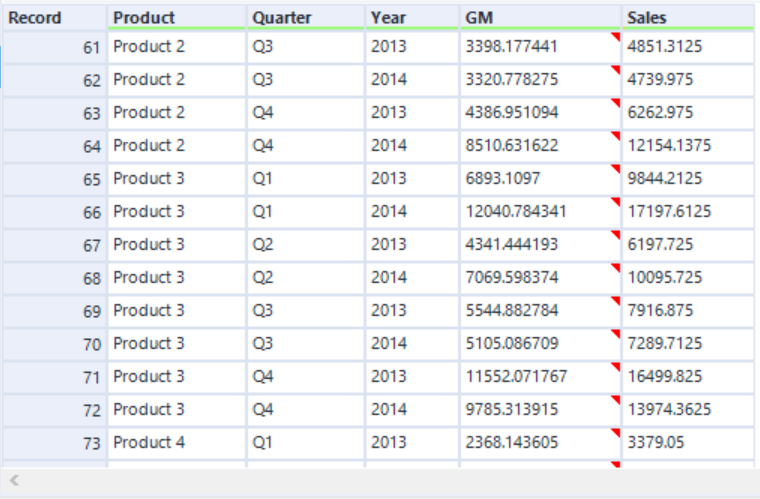
In the configuration pane, the data is grouped by the Product, Quarter and Year. The column headers are changed for Measure and the method to aggregate the values is set to sum. The outcome is depicted as follows: