Cohort analysis provides a better understanding of the user trends and behaviours. On the train of LODs, it is a good way to analyse the data and we will use these expressions to create a view in Tableau.
We will be using Superstore dataset again for this exercise. What we want to see when customers have made their first purchase. We need to put Year of Order Date onto Columns and Sales onto Rows. As the data in the view is not displayed by customer, we will use an LOD for this. So, your view and your calculation should look like this:
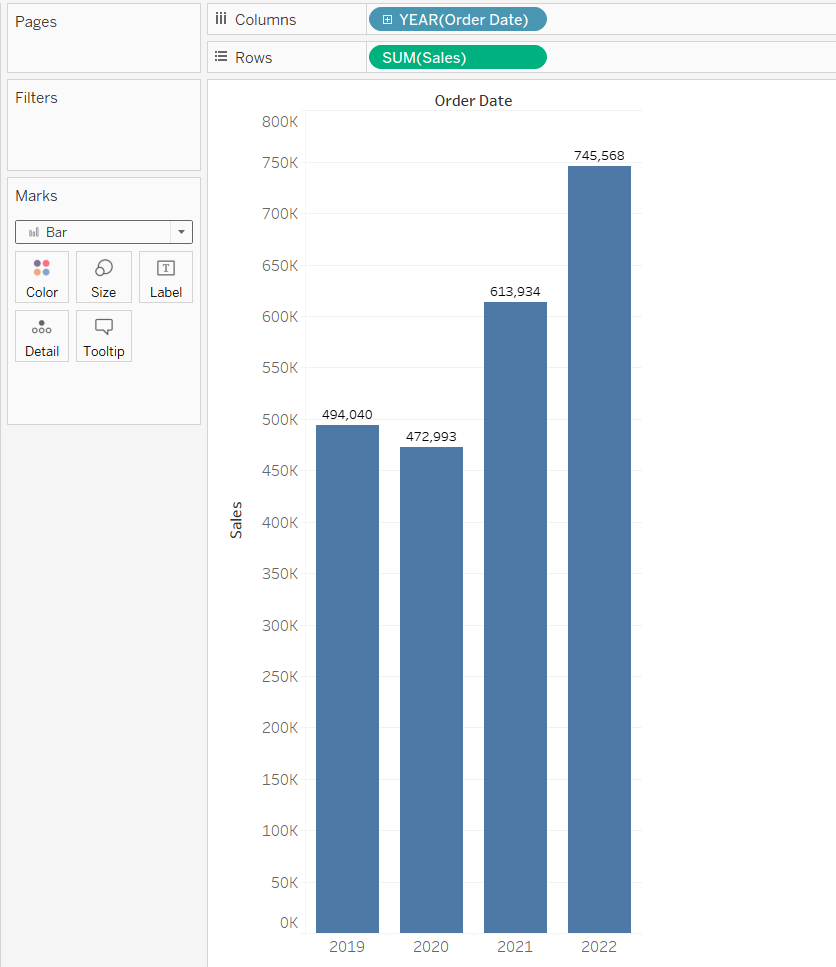

This LOD is useful that is why we have seen it before at different occasions.
Now that we have created that LOD, we need to drag that onto Colour. This is what you should get:
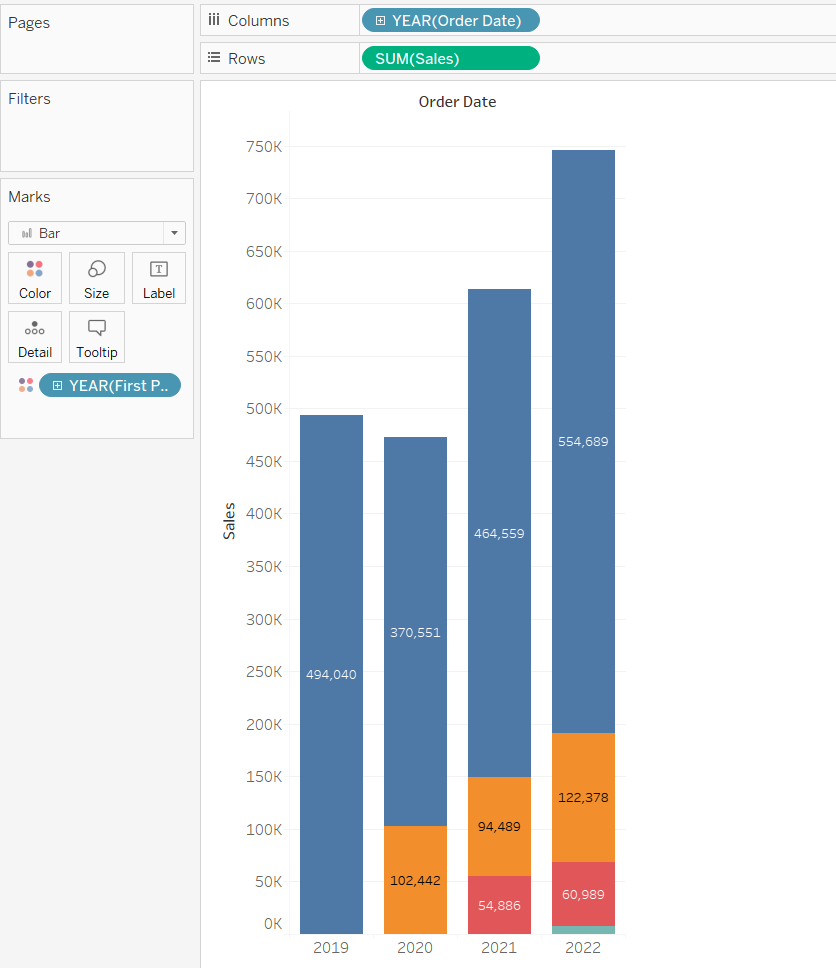
And voila! Now this shows that for example in 2020, the customers, who's first purchase was in 2019, have generated $370,551 in Sales.
To go one step forward in the analysis, we can have a percent of total table calculation to see what proportion of Sales each cohort makes up each year. To do that, right click on the Sales measure and select 'Add a Table Calculation'. Then you should get a pop-up window that looks like this:
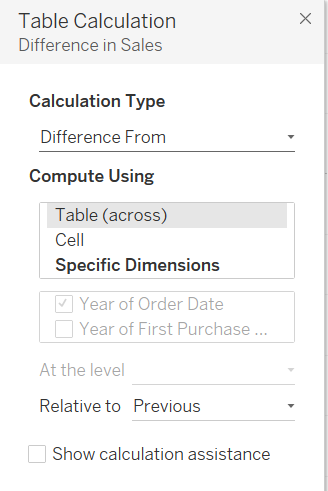
Here, we want to select Percent of Total as a Calculation Type and select Specific Dimensions and select Year of First Purchase... and unselect Year of Order Date. Your window should now look like this:
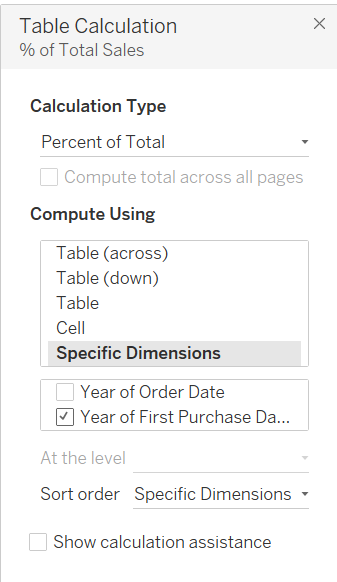
We have to deselect 'Year of Order Date' as that is what we want for the chart to restart by, so we get analysis of each year.
Your final view should look like this:
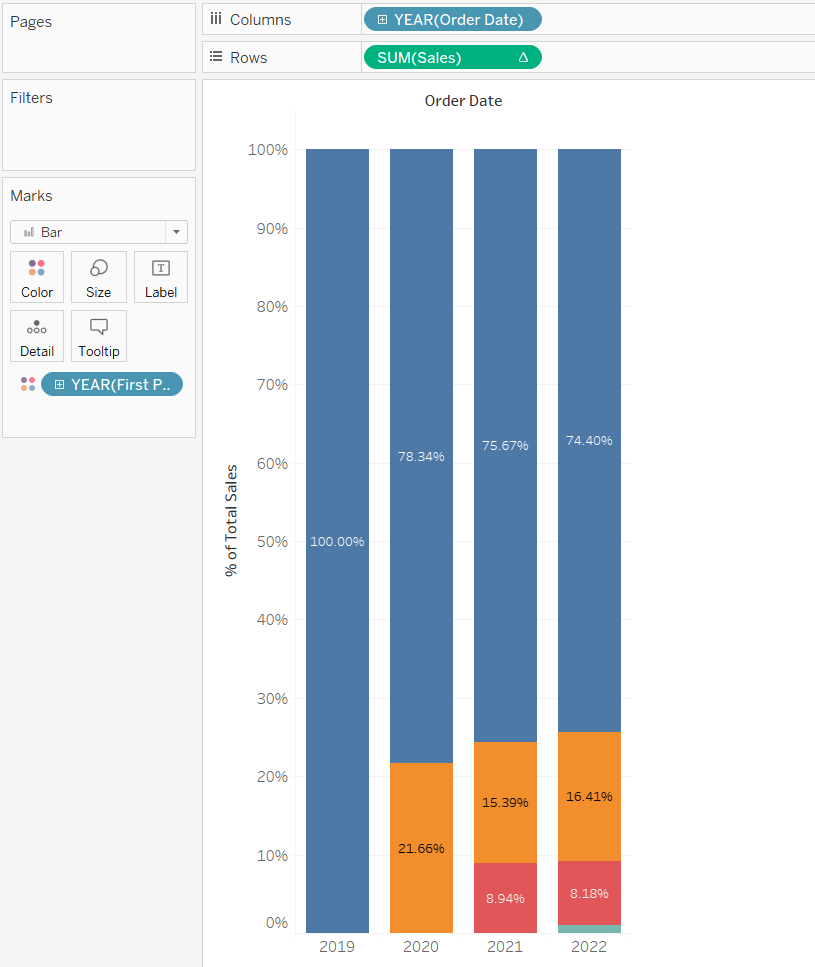
Now, you should be able to make quick and effective analysis from each of the years. This is why this is useful!
Hope this helps!
