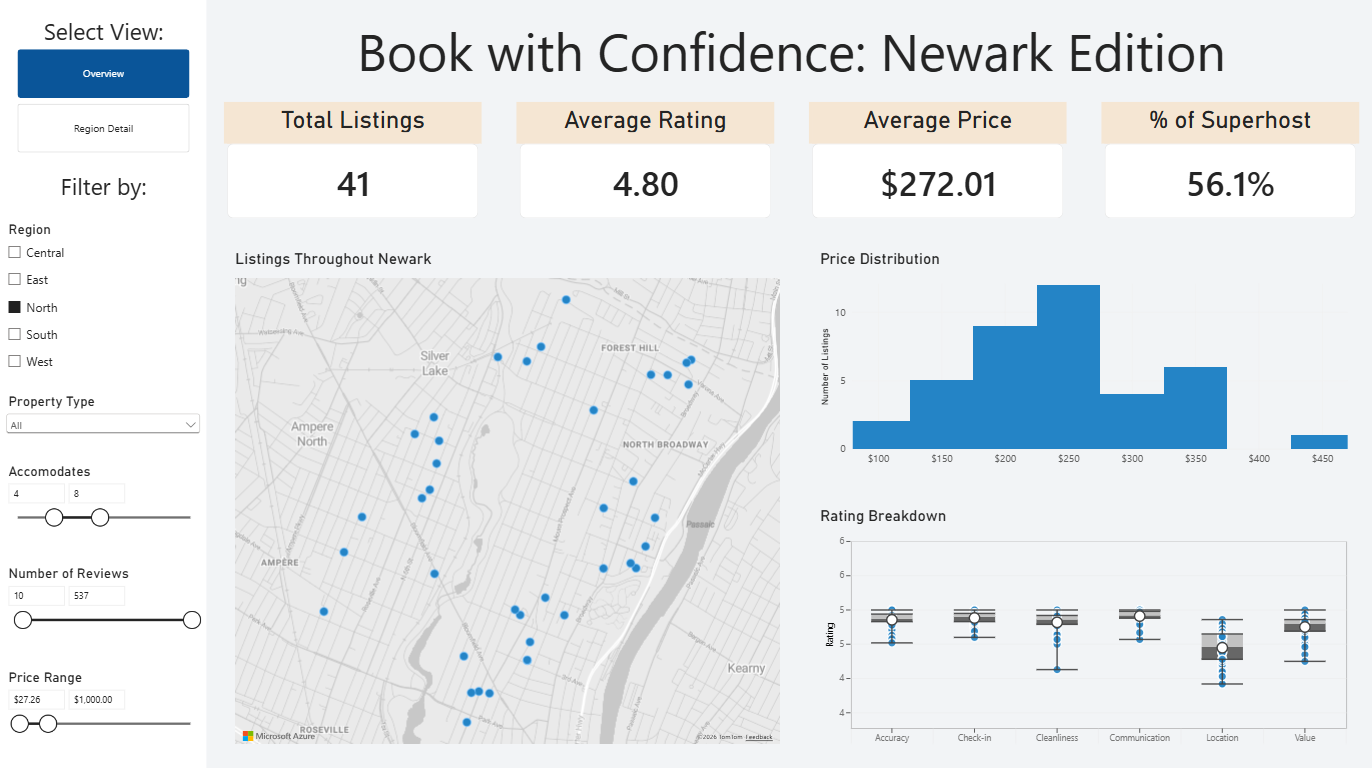
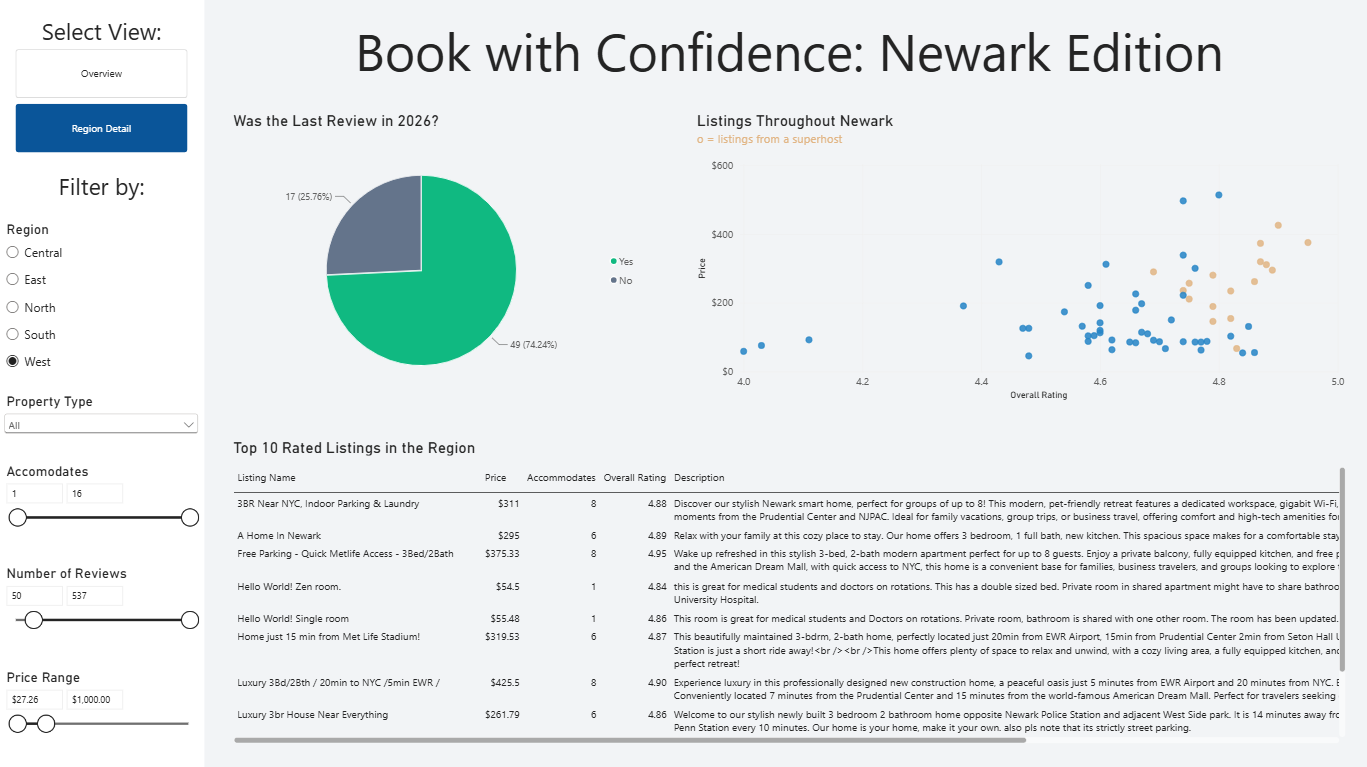
This project had us pick up Power BI and build a dashboard from real data, with a user story guiding the design choices. I went with Airbnb data for Newark, New Jersey, which is where I grew up. I pulled two CSVs to start, listings and reviews, and opened everything in Power Query to explore, but quickly realized they were missing some info I wanted, so I went back for the csv.gz file instead. My Power BI did not read the compressed files natively, so I had to find a workaround: unzipping it in memory using M code in the Advanced Editor, decompressing the stream, parsing it as CSV, and promoting the first row to headers. From there I stripped out anything unnecessary, URLs, scrape metadata, fully null columns like host response time, which left me with a clear granularity of one row per listing.
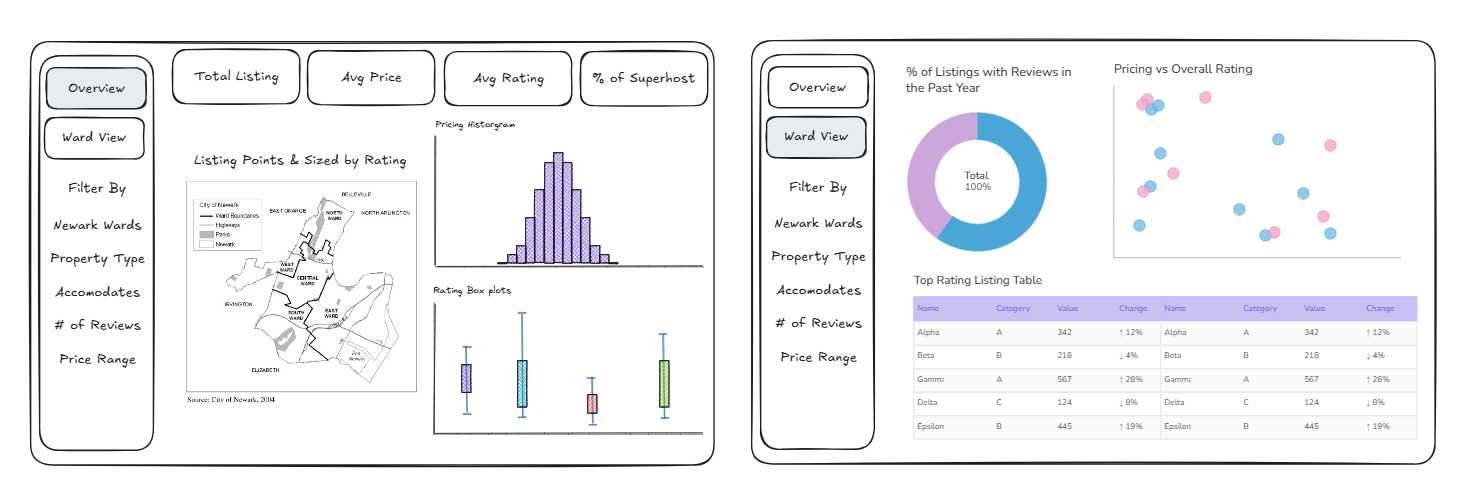
This time around it took me longer to settle on a user story. I settled on building for the Newark tourism board, trying to understand how tourists engage with the city’s rental market and help future visitors find trustworthy stays. That framing made the sketch come together: an overview page with four KPIs (listing count, avg price, avg rating, percent superhost), a map sized by rating, a pricing histogram, and a boxplot across the rating categories, then a second page drilling into the ward level with a pie chart on recent review activity, a price-versus-rating scatter plot, and a top listings table.
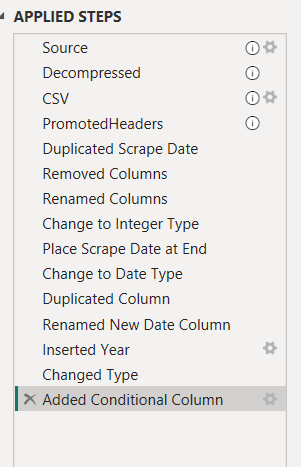
Formatting ate up more time than expected, just getting everything visually consistent. The bigger blocker was the boxplot, since the review categories were separate columns instead of one field I could split by. My fix was building a small table with those six columns plus the listing ID, then unpivoting them so I had one column of category names and one of scores, which is what made the visual work. The lesson for today was that the data rarely comes in the shape you want, and most of the actual problem-solving happens before a single chart gets built