


This was going to be a tip on how to format my bump chart I’ve been building but I along the way I found something out that needs a tip on its own
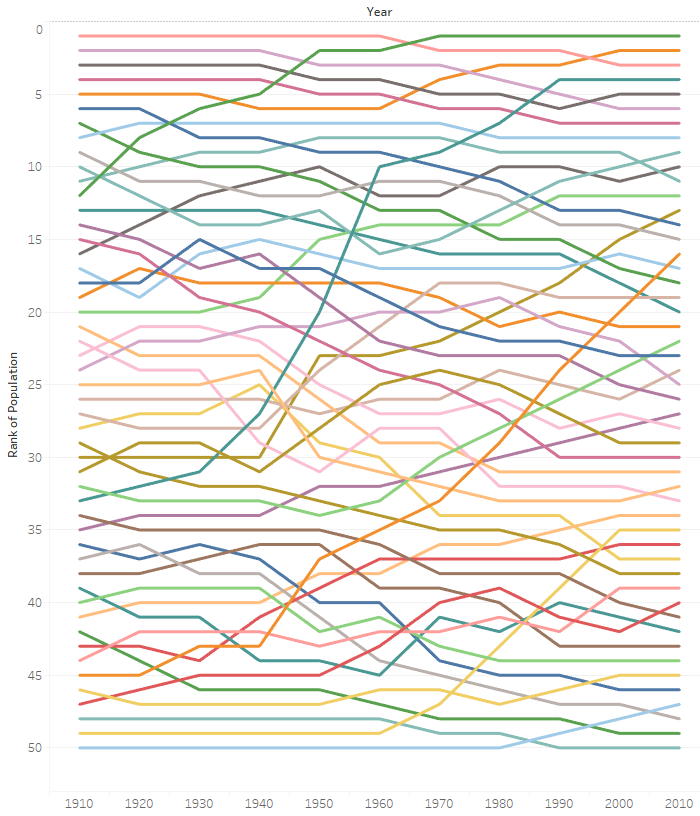
You can see here that the axis for years is along the bottom of the chart. I really want it to be at the top.
In order to this we go to the analysis tab on the menu bar, select table layout -> advanced. Then uncheck “Show innermost level at bottom of view when there is a vertical axis” and BAM your axis shifts to the top
