


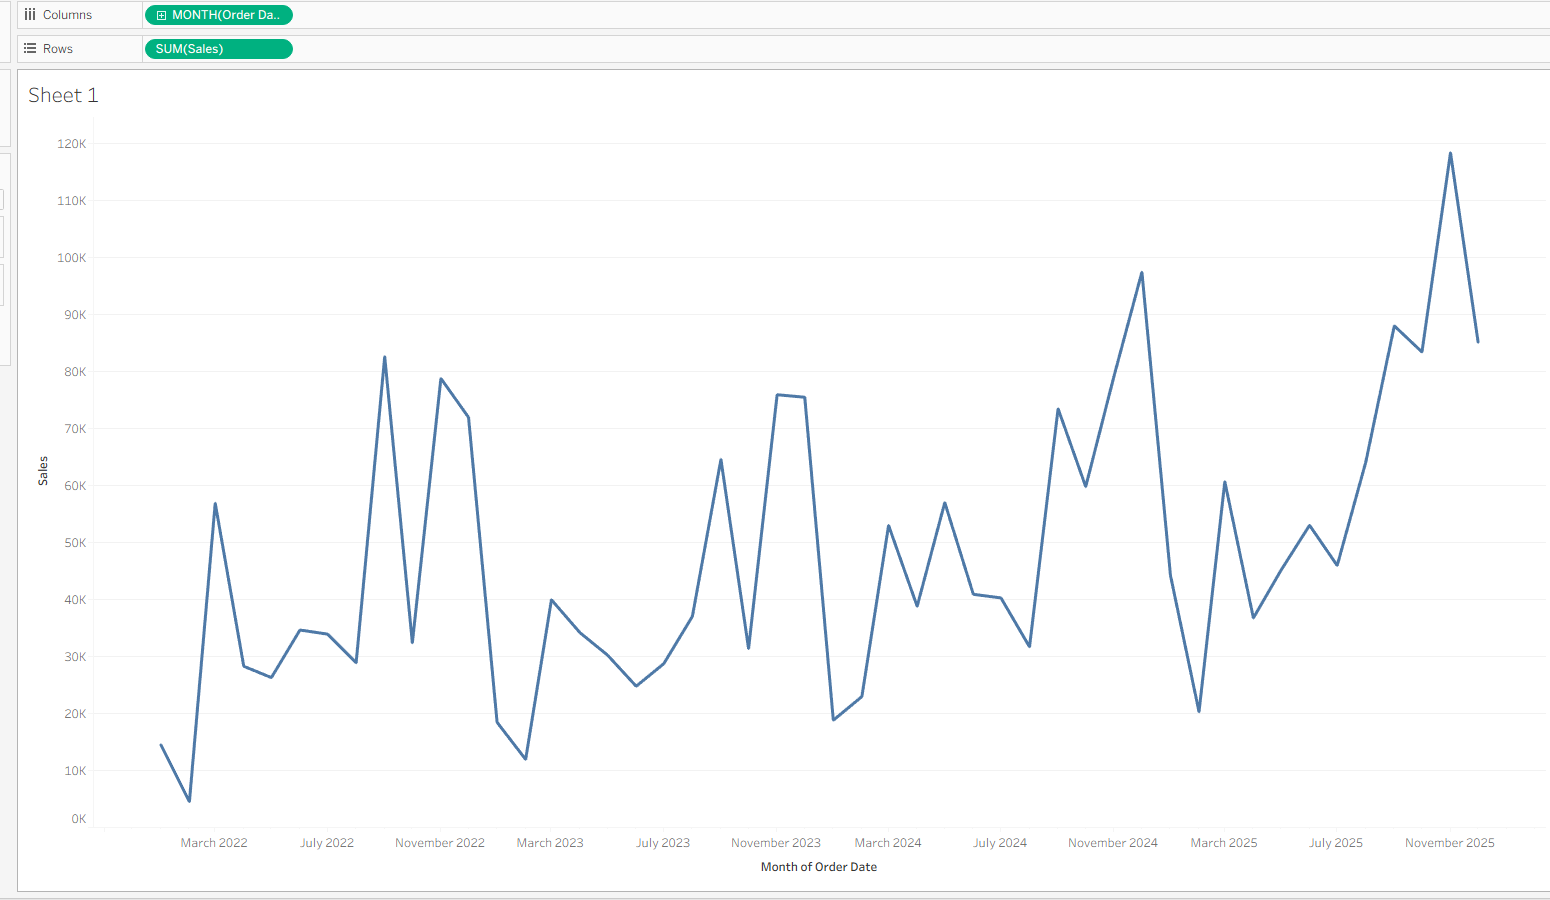
When analysing data over time, line charts can often look messy and have sharp fluctuations. Moving averages allow you to smooth out fluctuations and highlight longer term analysis. In this blog, I’ll show how to build moving averages in Tableau and explain when to use them.
What is a moving average?
A moving average calculates the average value over a specified number of time periods to smooth out short-term fluctuations and focus on longer-term trends.
They are commonly used in sales and financial analysis to make trends easier to interpret.
For example, a 6-month moving average calculates the average value across the current month and the previous five months at each point in time.
How to use in Tableau:
- Create a basic line chart - I used Order Date and sales.
- Hit the dropdown on sales and select 'Quick table calc - Moving Average'
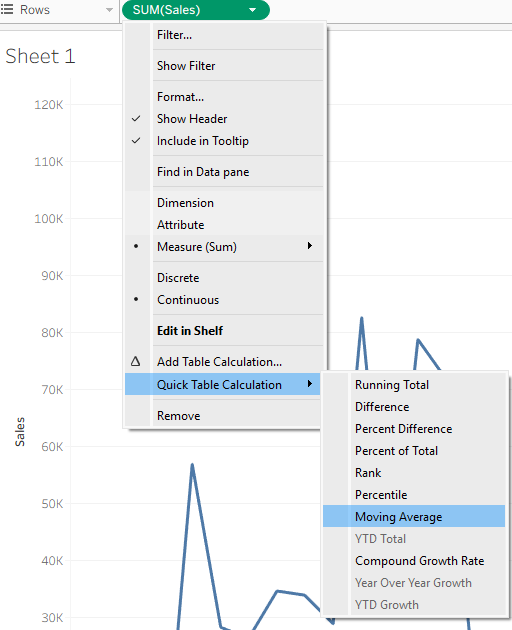
- Hit the Sales pill again and 'Edit table calc'. The following dropdown appears:
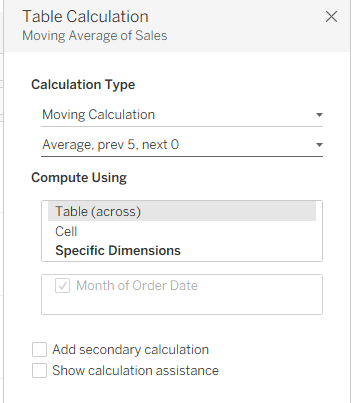
- Set it to Average, prev 5, next 0. This will calculate the average of the current month and the previous five months to smooth short-term fluctuations and highlight longer-term trends.
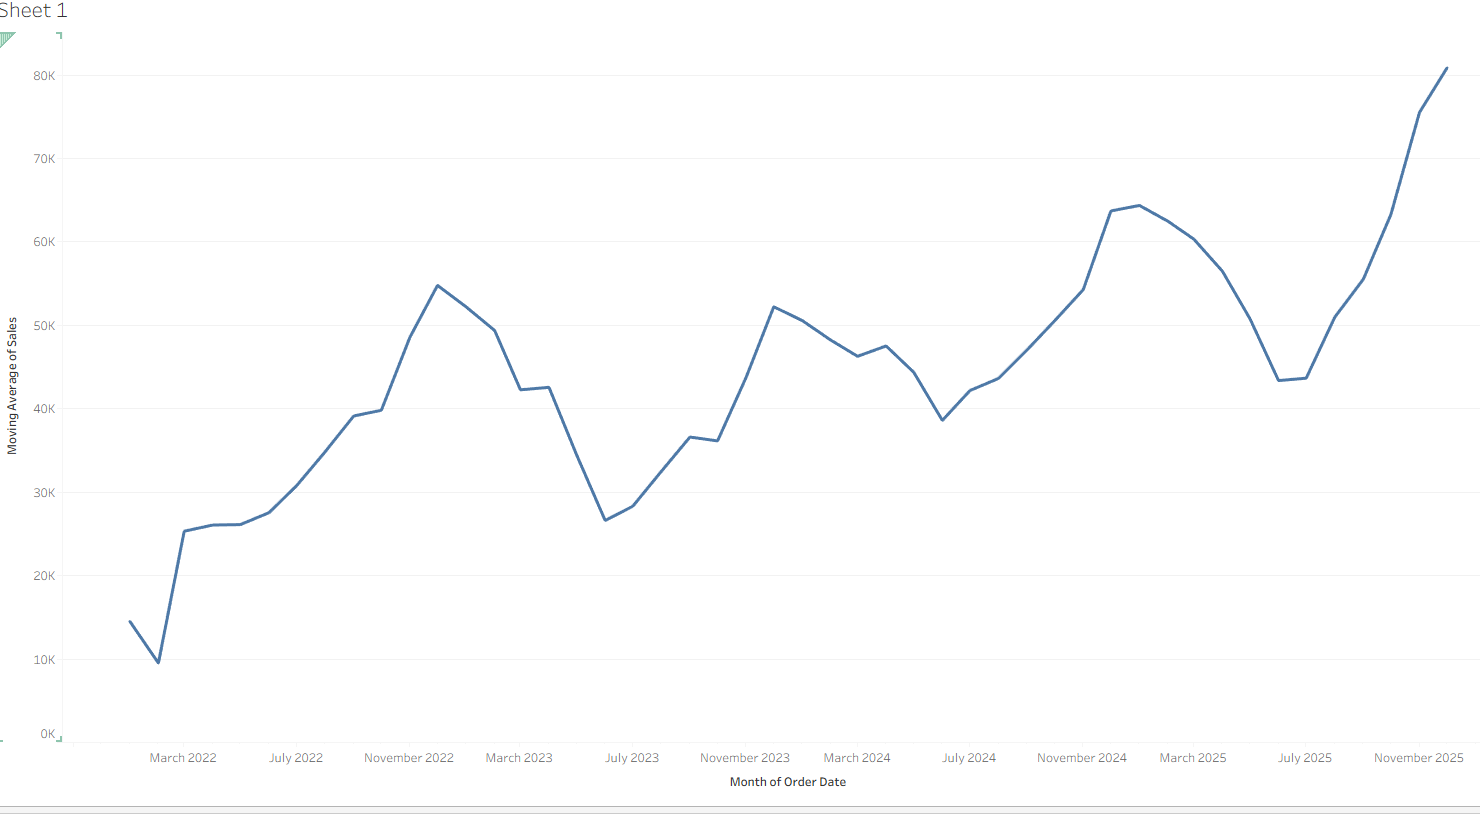
Once applied, the line becomes much smoother, making the overall trend easier to interpret:
What is the underlying calc?
If you hold Ctrl and drag the table calculation into the data pane, you can see the underlying formula.
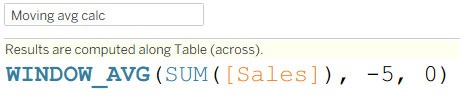
Moving Averages are created using Window Functions. These functions allow Tableau to look forward or backwards across a defined 'Window' of data relative to each mark in the view.
Why are moving averages useful?
- Reduce your data's short-term volatility
- More easy to recognise long-term trends
- Minimises the effects of anomalies or isolated spikes
- Makes time-series charts easier to understand/gain insights from
Real-World Examples:
- Finance: Examining patterns in stock prices and lowering market volatility
- Football: Analysing a player's or team's performance across a series of games/seasons
- Sales: Monitoring revenue trends without seasonal noise
Final Notes:
Moving averages are a very handy tool in Tableau when doing time-series analysis. They can greatly improve the readability of line charts and enable users to gain quick insights. Understanding the underlying window functions can also help you use and troubleshoot them where necessary.