


Have you ever wondered how to filter in Tableau? Well, I am here to help you.
In Tableau, filtering can be extremely useful as you can exclude specific categories to see the data you are actually interested in. This can also be used with dates if you would like to see, for example, your companies' sales from March 1st-June 1st. Essentially, filtering makes your life easier for analysis however, how do you choose the tab that will best suit your situation? Let me go through them all and how they work.
Tab 1 - General
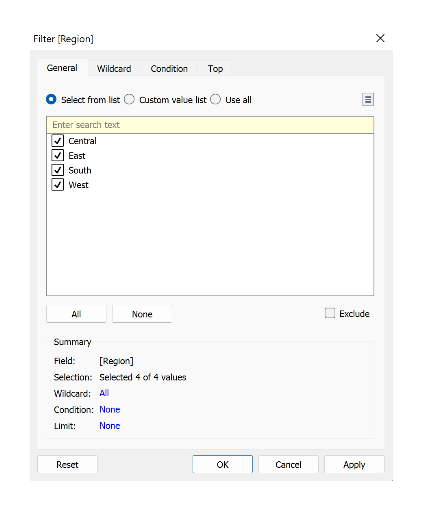
As you can see below, the general tab has several buttons however, I want you to focus on the exclude and boxes with ticks next to the categories.
Click the tick next to any category and click apply to remove this from your view. Similarly, if have an extremely long list of categories you can click exclude which will exclude them all and you can manually include the categories you want to see. This just saves you time if you only want to include a small number of categories from a long list.
Tab 2 - Wildcard
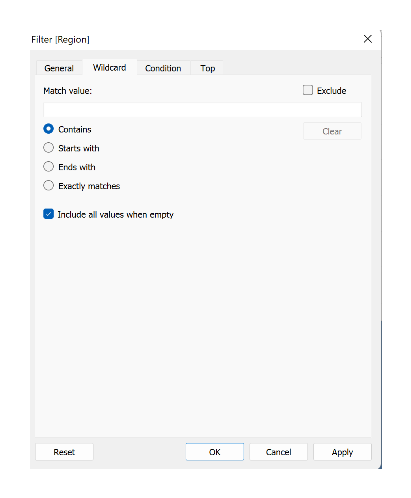
The Wildcard tab can be used to include values that contain, start, end or match a character or set of characters in a category. For example, if I used "st" in the contains and clicked apply, the only categories that would show up are East and West. This is because they are the only 2/4 regions that contain "st". Similarly, if I chose "s" on starts with, only South would show.
Tab 3 - Condition
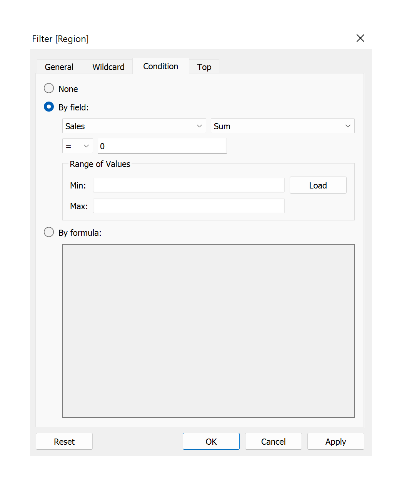
This filtering tab has a few more options than the previous two. The general idea for this tab is to filter your data based on a set of conditions of a field.
For this example, I will be using Sales. You can either set a condition to be equals to, less than, less than or equal to, greater than, greater than or equal to, or not equals to. Yes, quite a few options, but they are all important to be aware of. You can also set a range of minimum and maximum values or create a more complex formula however, you can still do a lot without creating a formula.
Once you have chosen the conditions your field will filter by, it will filter the unwanted data from the view.
Tab 4 - Top
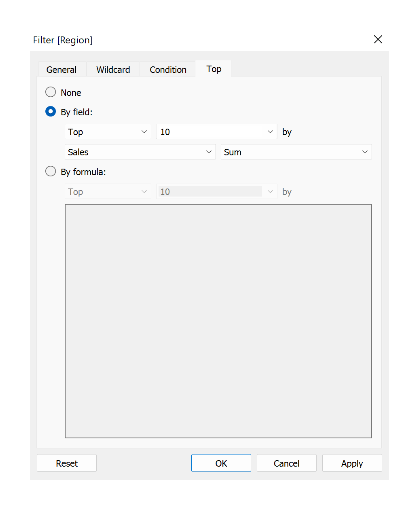
The final tab, top, can be useful if you want to show the top/bottom X amount of values from a given field. You can change this to any number you want and similar to the condition tab there is a formula if you want to create more complex filters.
In the example of sales, you can show the top 10 best selling products in the East region.
Conclusion
It is important to understand filtering and what it can do for you in your analysis as showing less can sometimes mean more. If you are trying to answer a very specific question then you need to ensure that the data you see is all relevant otherwise you may overlook what is important.
A quick tip, if you are having trouble with your filters check the general tab at the bottom. This will show all of your current filters in a summarised format.