


Plan for the Day:
- Download dataset and explore key fields in each dataset to find out how to join them.
- Plan out what I want to explore in my dashboard and create a wireframe
- Create the dashboard + Interactivity
- Plan my presentation
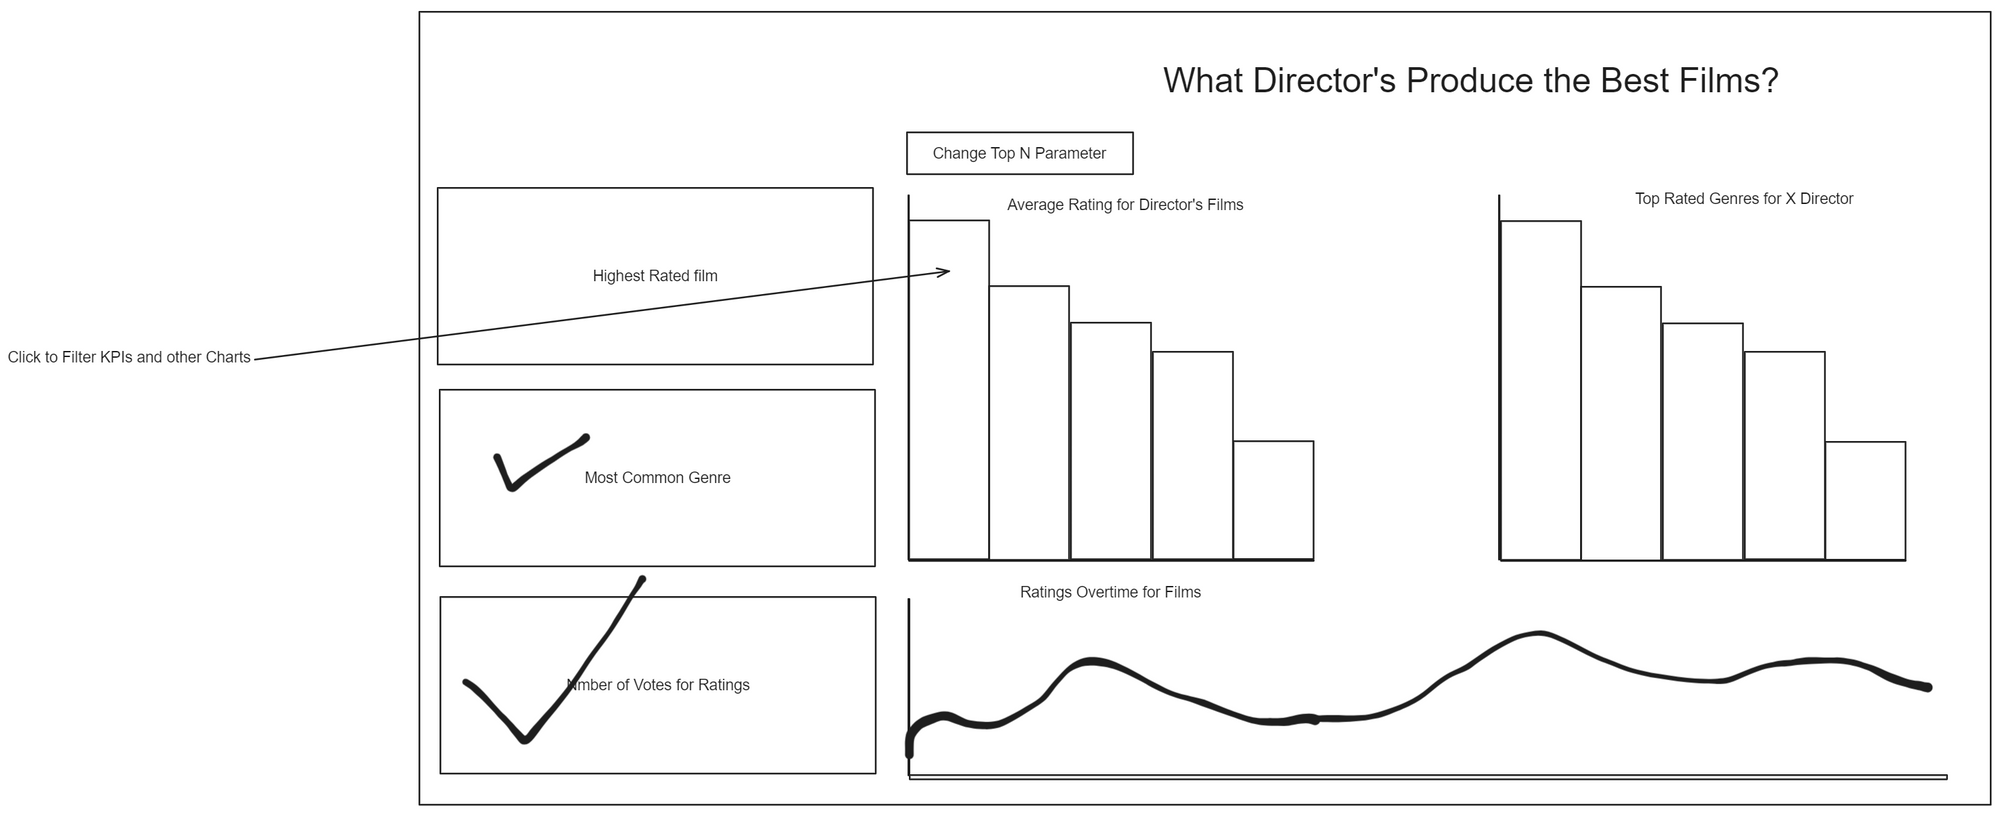
Wireframe:
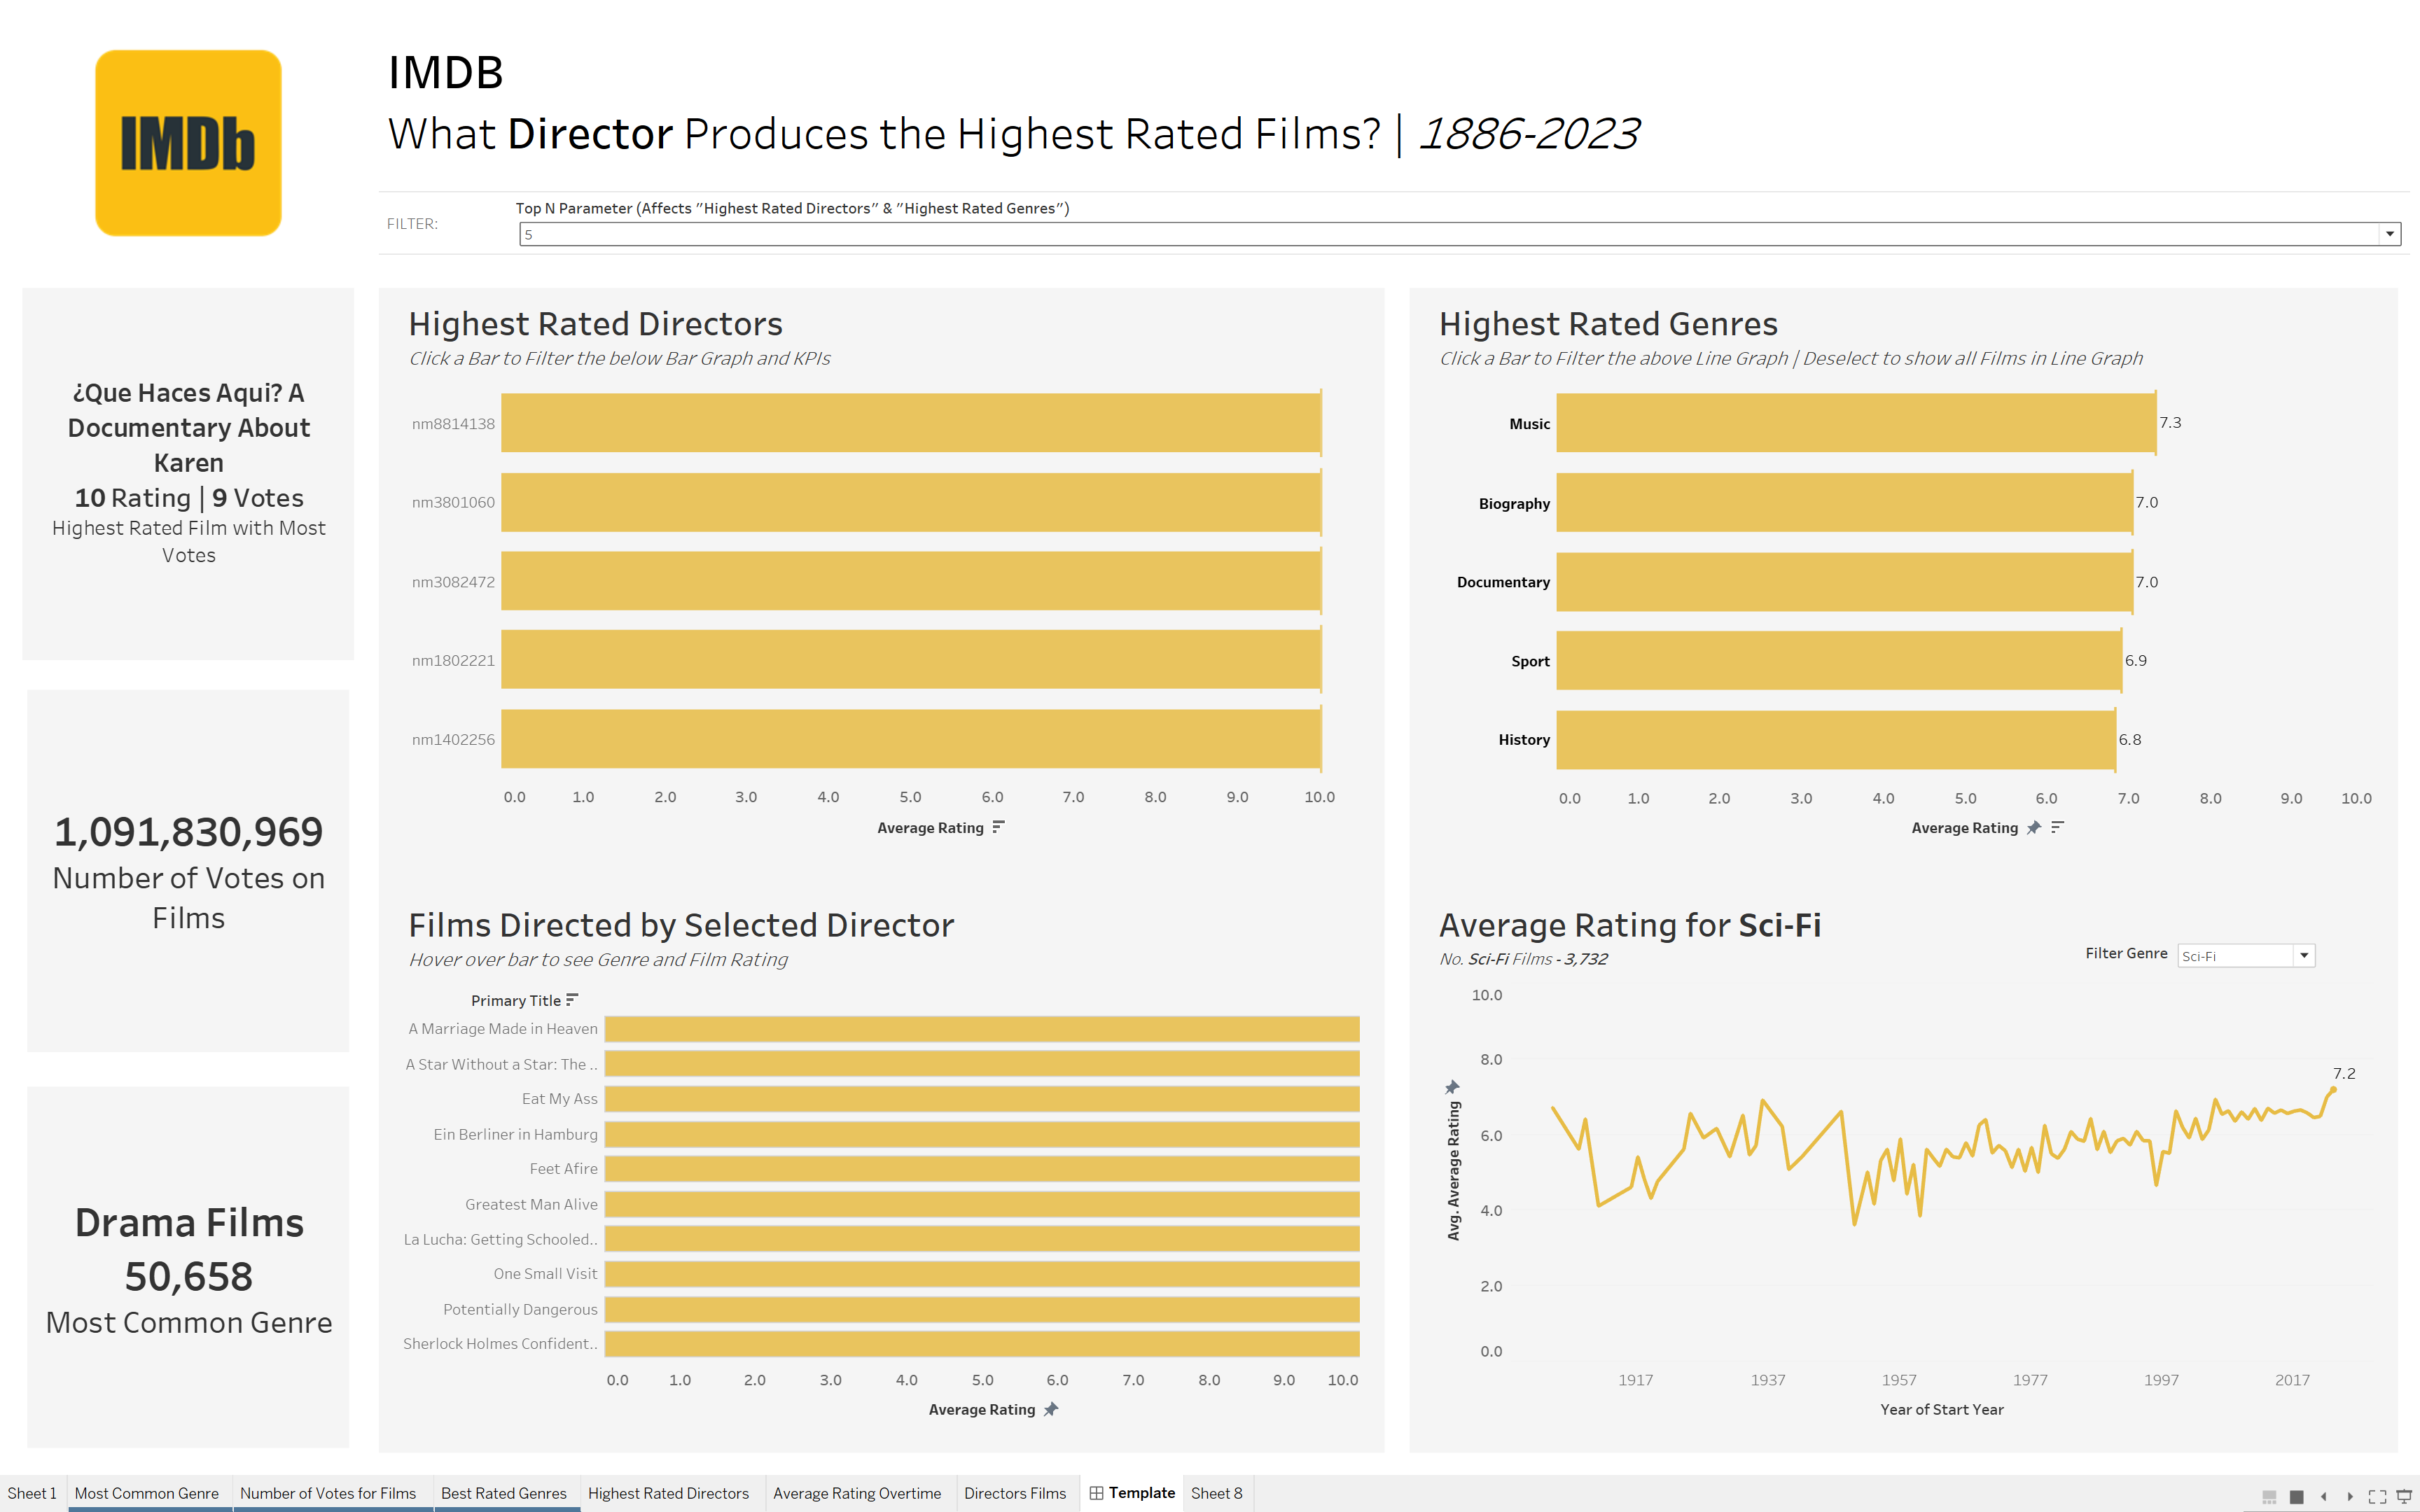
Created Dashboard:
Challenges from today:
The first challenge from today was joining the datasets together. What helped was that I already checked for key fields which made this significantly easier however, the joins themselves made it challenging. This did not take too long to figure out but was worth noting.
The majority of the challenges from today's project were in the dashboard building itself. I tried to do a lot of hacky methods in Tableau to get things to work and still had minimal luck. For example, I wanted to show the Top Rated films however, as there were several 10 rated films it would show the first one in the alphabet (See first KPI in picture above). What I wanted to happen was that it would find the top rated films and then only show the movie/show with the most votes to reach that rating - essentially showing the most rated and highest rated film and not lesser known, fewer voted films.
Another Tableau issue that I think will be easy to fix was that my top directors would only show the highest value rating for one film rather than an average amongst all their films.
What went well:
Today I was happy with my planning in the data prep stage and my dashboard end product and looking forward to the rest of the week!