


When you have made all of your charts in Tableau you are going to want to bring them all together in a dashboard to V I S U A L I S E. However, if you haven't noticed, the way you make dashboards can be complex if you are not familiar with the tools and how they interact with one another.
What are containers?
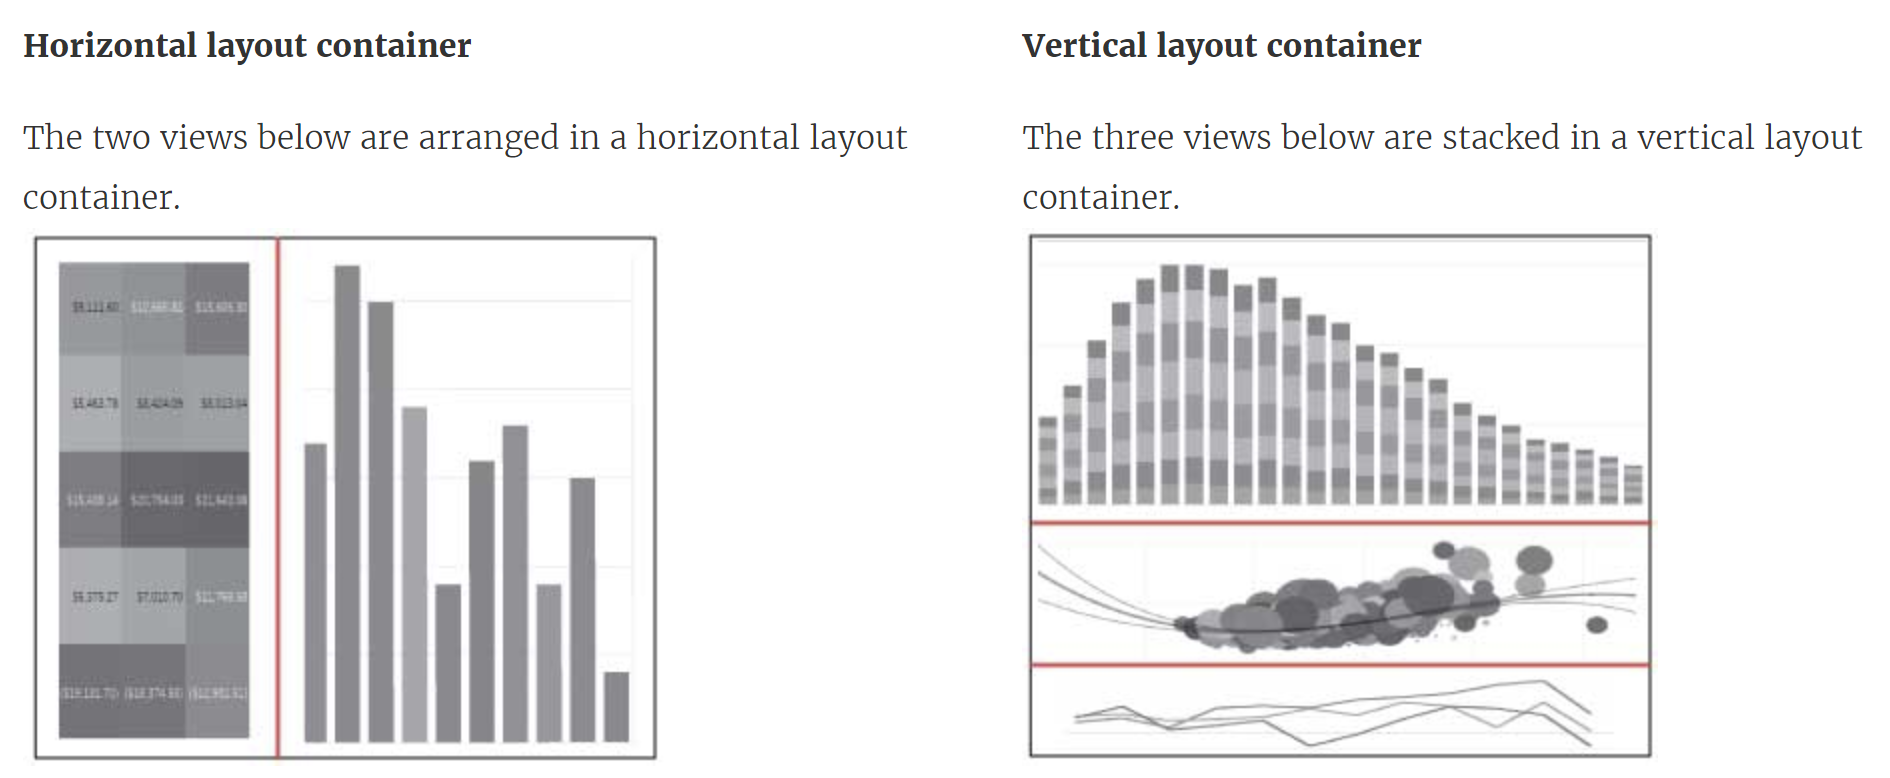
Containers allow you to better organise your dashboard. There are two types: horizontal and vertical. Horizontal containers control the width of the view and vertical containers control the height. See below for an example:
But why is this important for your dashboards? Why can't you just use floats? Floats are okay for select things on your dashboard but will cause problems and eat up your time if you realise halfway through a project you need to make adjustments and add another section. Have fun moving 30 sheets and filters and trying to align them perfectly... Not to mention that when you view your dashboard on Tableau vs Tableau public, floating sheets can sometimes move which is very annoying.
Right, so how do you use containers effectively?
Step 1: Open a new dashboard
Step 2: Set your canvas size (you can change this in the future just adjust your holding container accordingly)
Step 3: Click floating (yes I said floating) and drag a vertical container on the canvas
Step 4: Change the x,y of your vertical container to 0,0 and the size to match the size of your canvas.
- This is being done as a placeholder for your dashboard.
Step 4.5: You can add some inner padding to your container so everything isn't pushed to the edges but this is personal preference :)
Step 5: Drag a TILED blank into the container so you now have a FLOATING vertical container with a TILED blank object inside it.
- This blank is temporary and can be moved once you have finished your dashboard.
- It is acting as a place holder whilst you work your way down your viz.
Now that you have the base for your canvas you can start messing around with containers to make your dashboard. I will show you my makeover monday alongside the hierarchy so you can see how I laid it all out. Remember, VERTICAL controls the height, and HORIZONTAL controls the width.
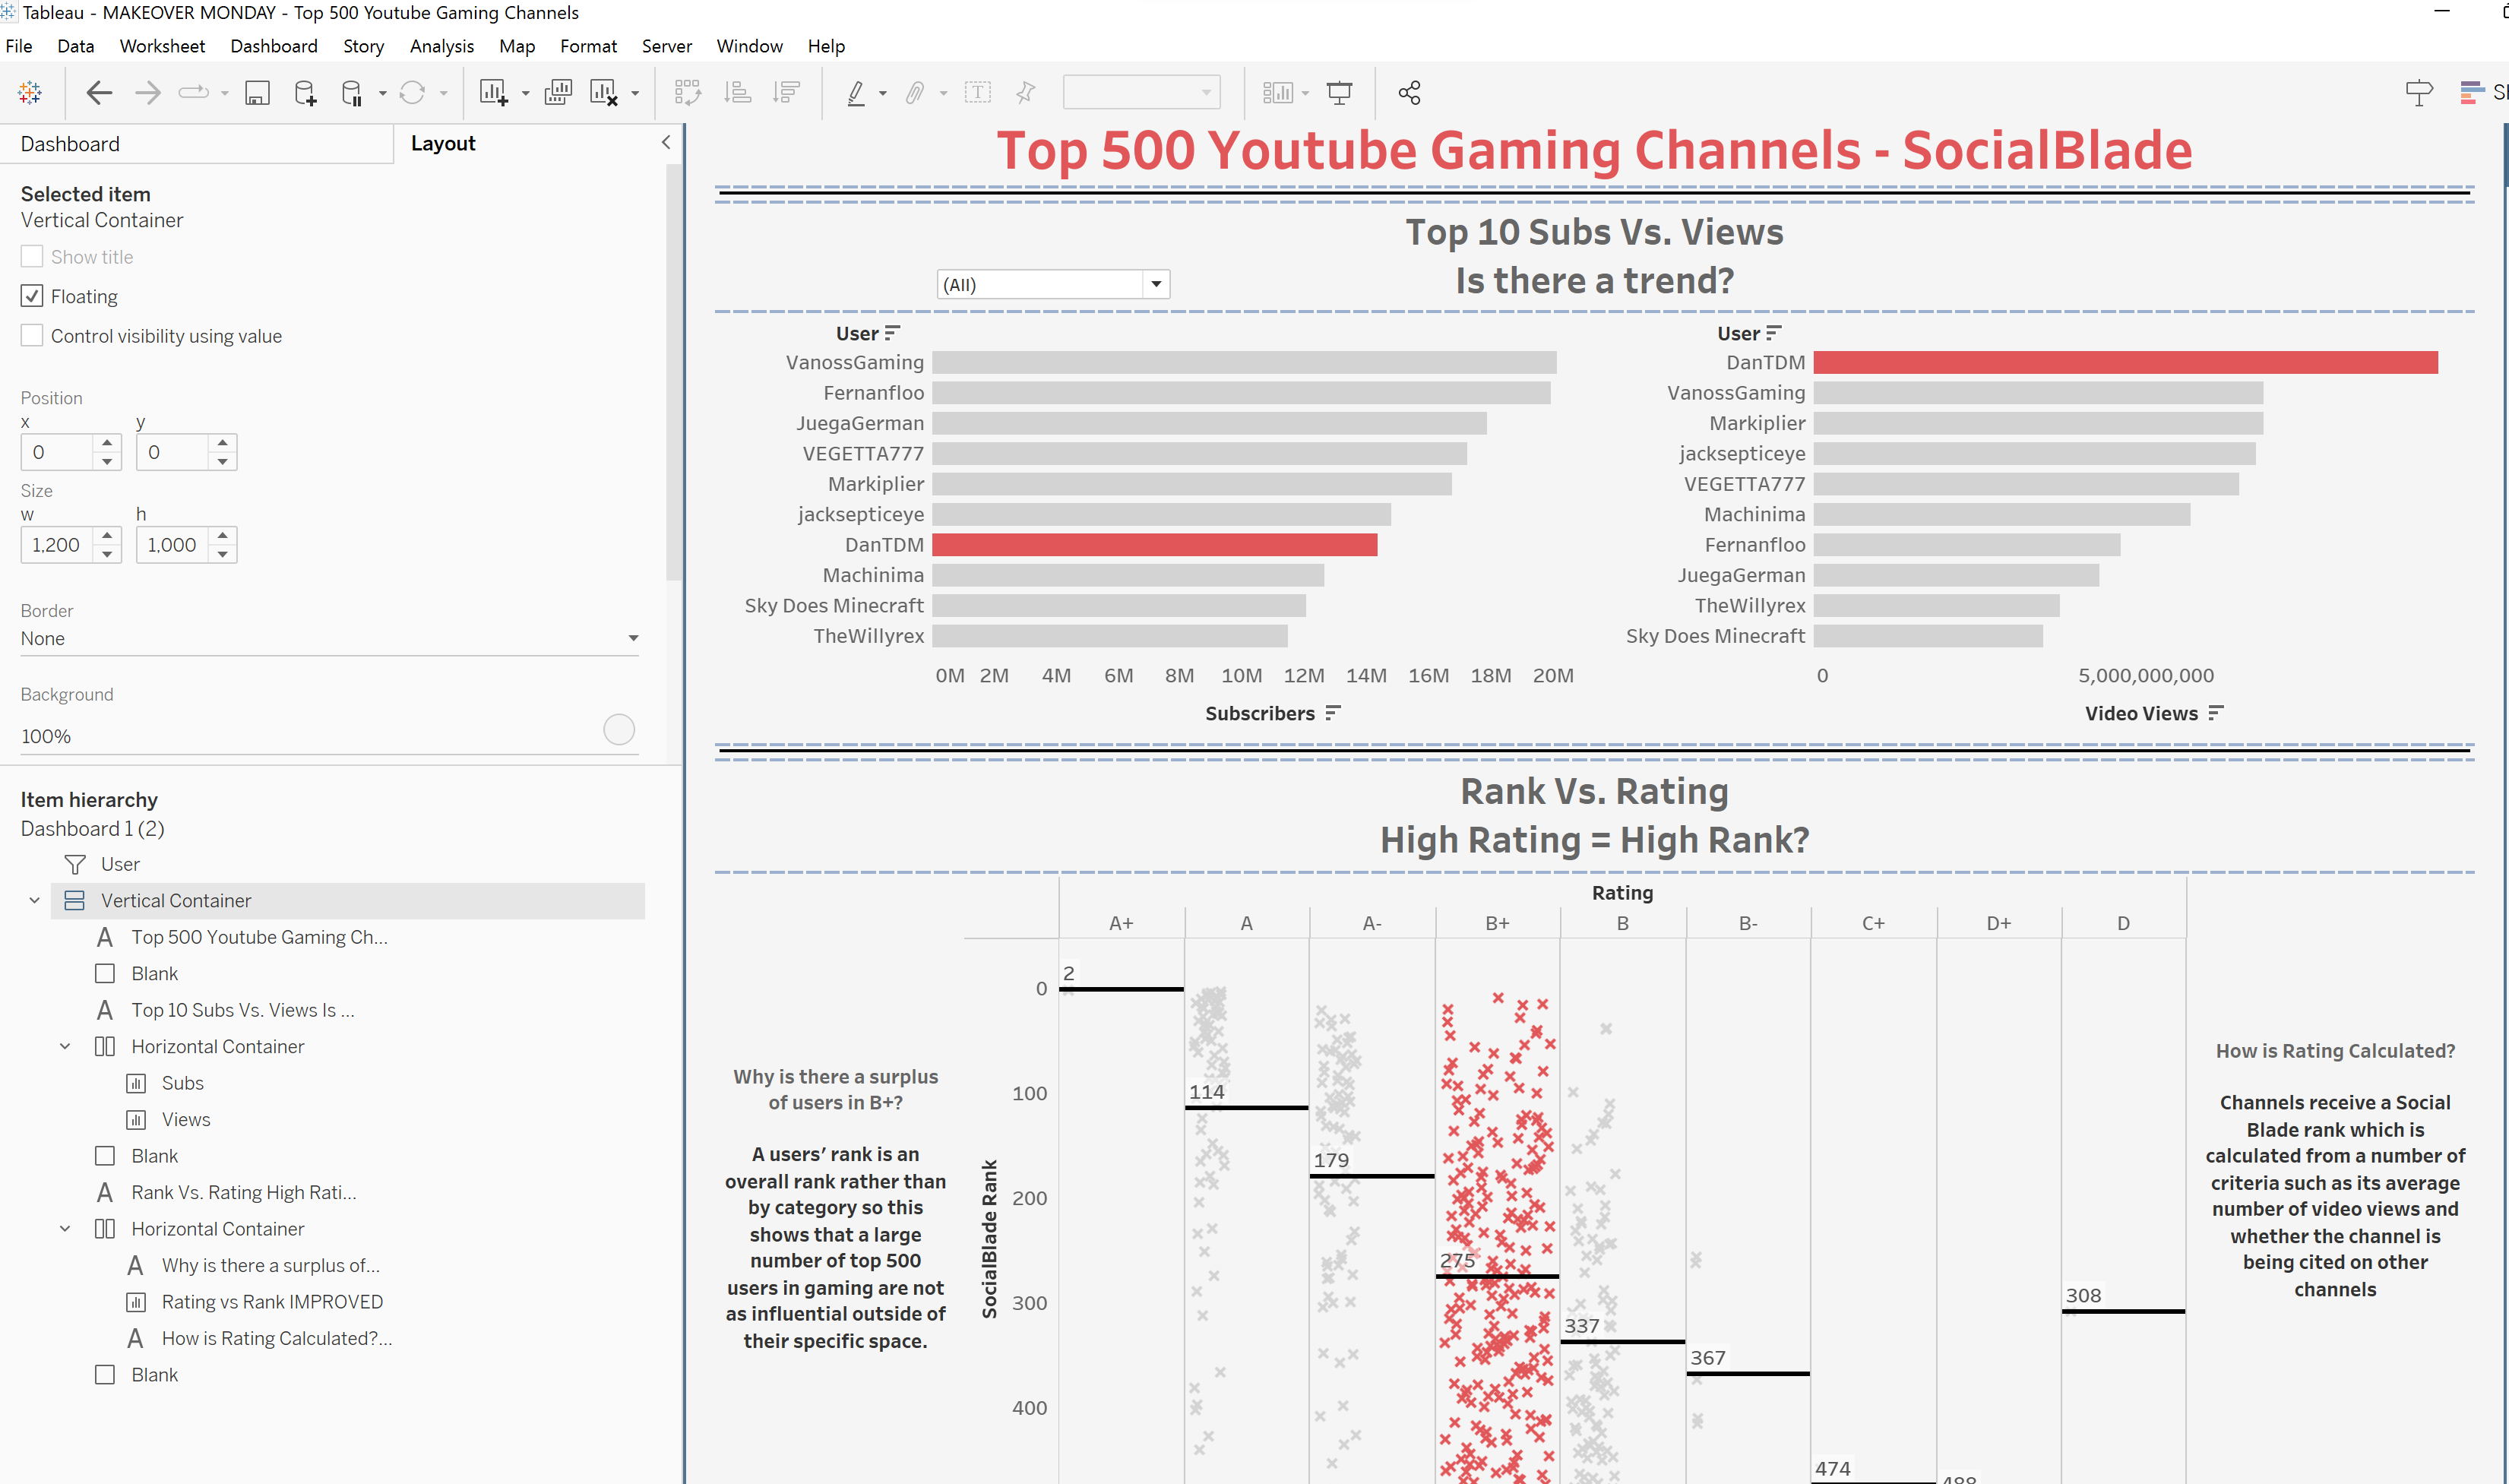
As you can see I mainly used horizontal containers because I wanted my graphs side by side rather than stacked on top of each other.
TIP: If you are using filters and want the user to interact with them, I would recommend setting them as floats as they are small and easy to move around. Another tip, use blanks to split up your sections and set their height to 10 and give them a border. This is personal preference once again.
Thank you for reading my blog! If you have any questions do not hesitate to message me :)