


For day 3 of dashboarding week, I was provided with the challenge of taking a Tableau dashboard and remaking it in Power BI. The dashboard provided to migrate was a Demo Insurance Dashboard created by Information Lab consultant Ellen Blackburn. To view the original dashboard, you can visit her Tableau Public here: https://public.tableau.com/app/profile/ellen4268/viz/DemoInsuranceDashboards-BrokerPortfolioRedesign/InsuranceDashboard-PortfolioView. As a twist, the original data was not provided. We were required to extract the data from her Tableau dashboard.
To start, I downloaded the original dashboard. I could not go into the data pane because the data was saved locally, so I instead extracted the data as a CSV using this method:
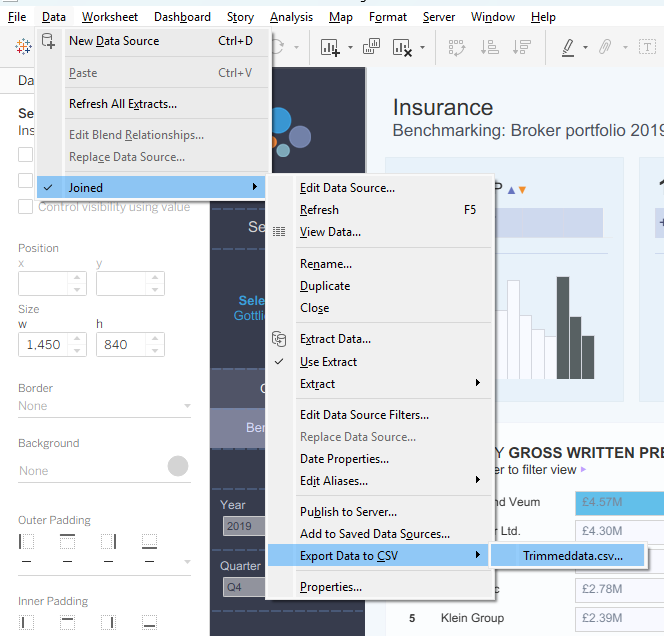
Viewing the exported CSV, almost all of the data was successfully exported. A few columns, however, could not be taken from the initial dashboard. The column named "Committed RRV %", for example, was fully null. This was most likely because this data was being pulled from a different location to populate the dashboard, so I could not pull it into my CSV.
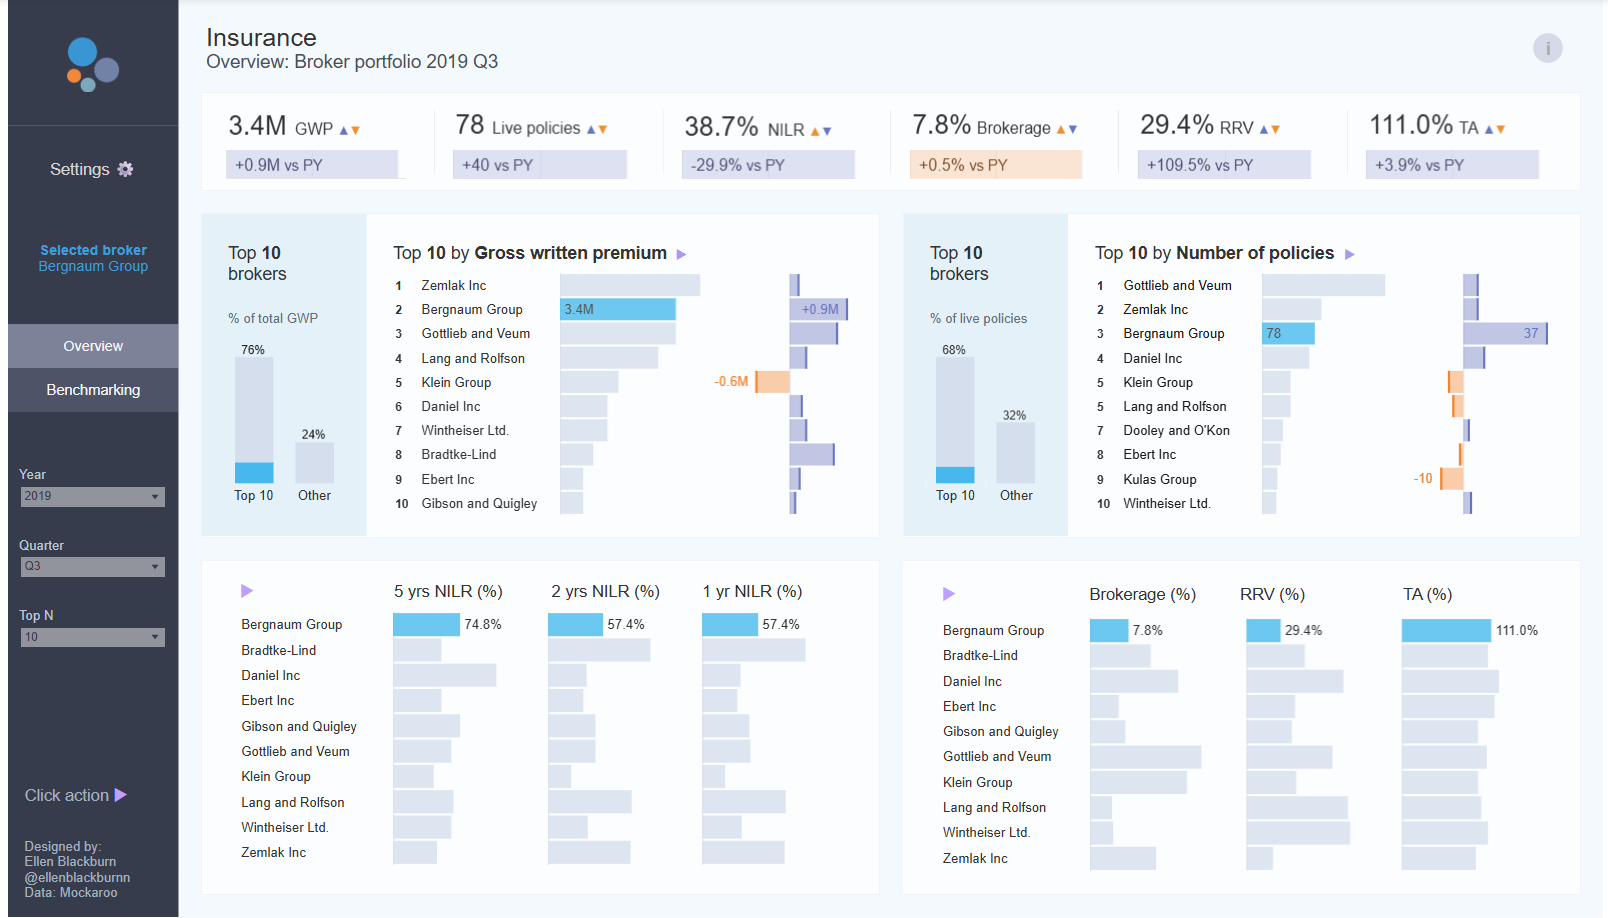
With all the data I was able to extract, I decided to put more time into the Benchmarking section of the dashboard as I thought it would be the most useful breakdown to do analysis on. I put the rest of my leftover time into working on the Overview section of the dashboard.
In the time provided, I was able to turn this:
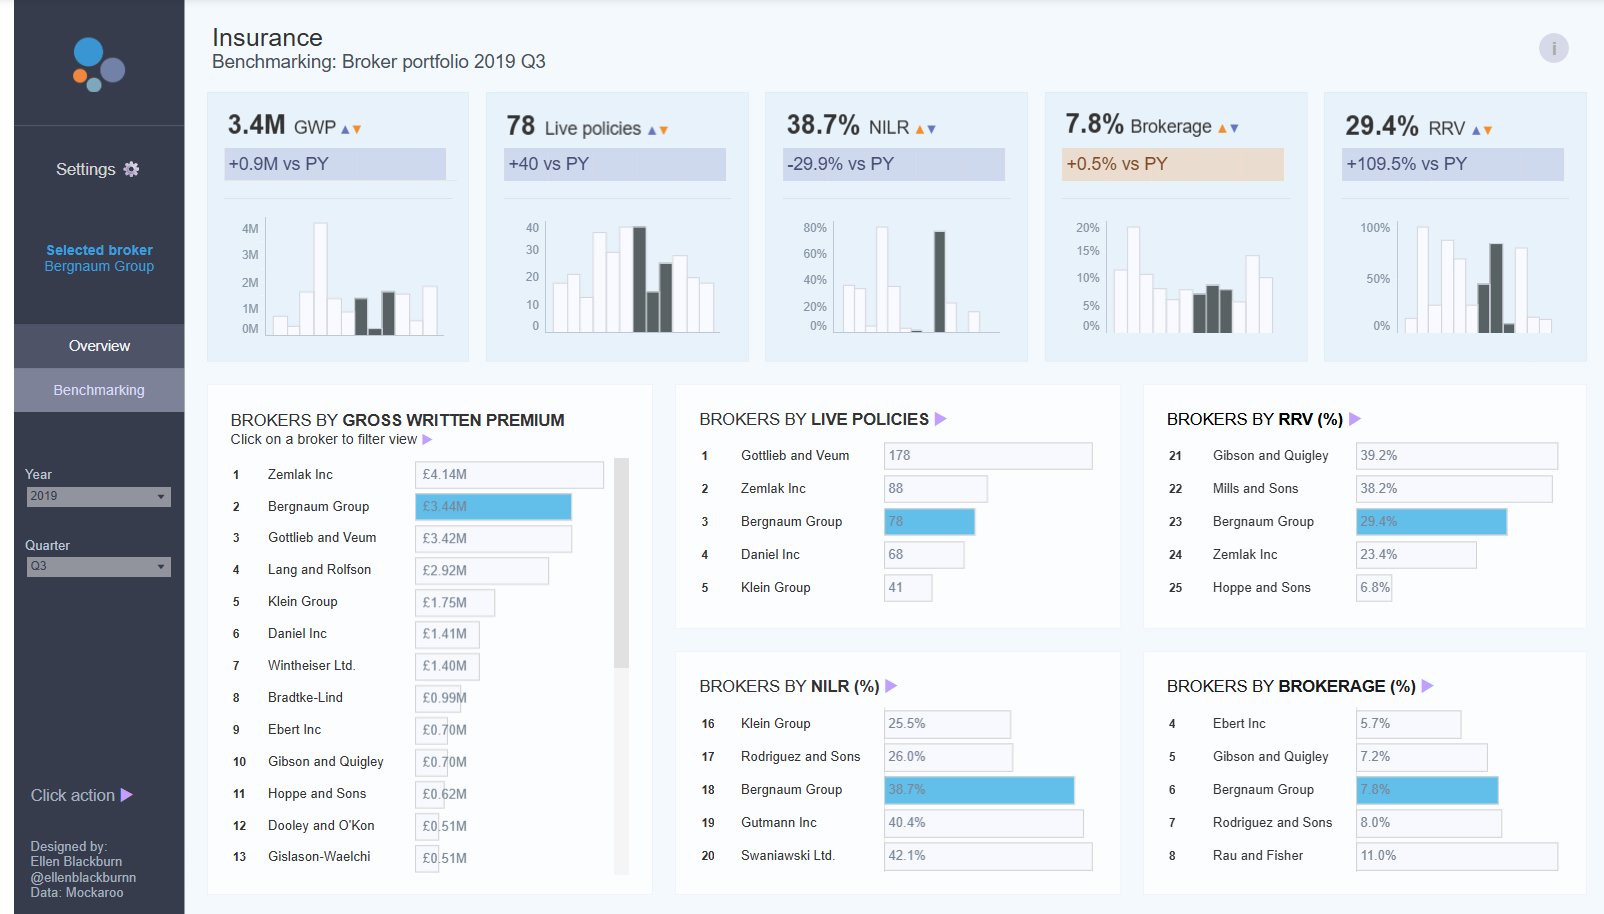
into this:
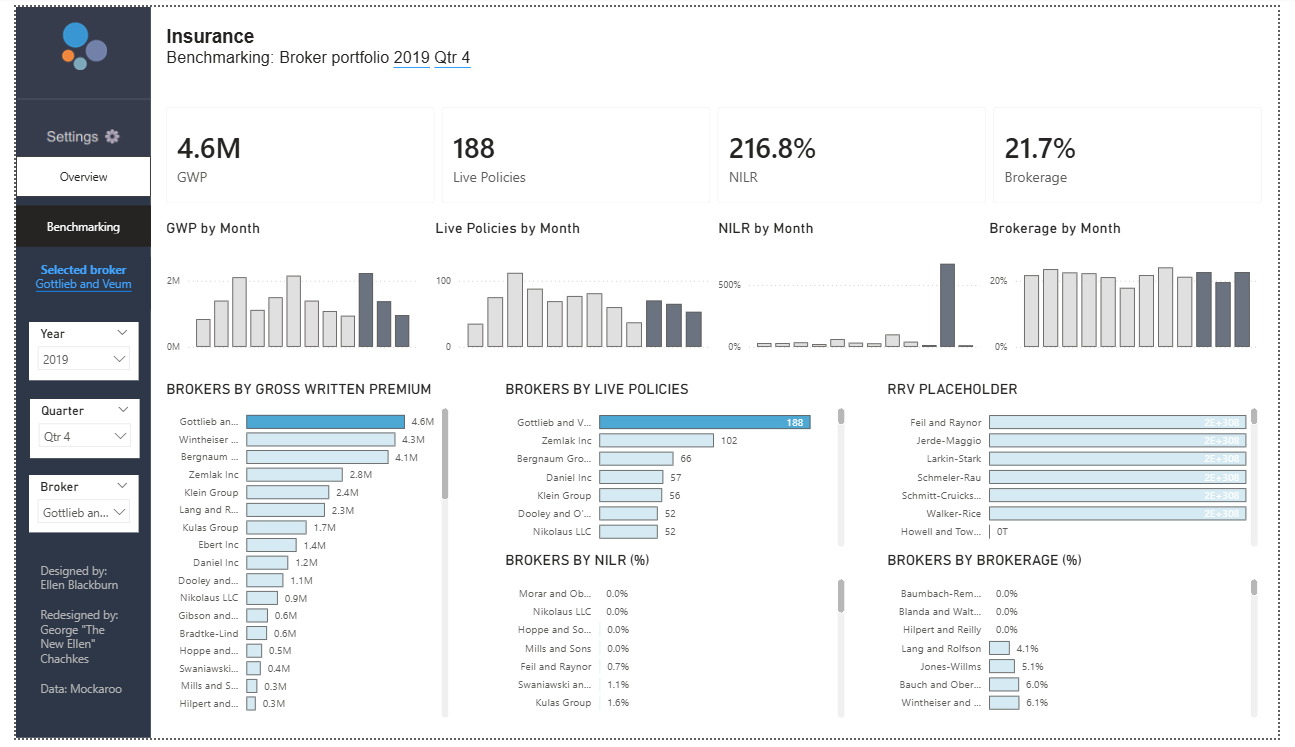
and this:
into this:
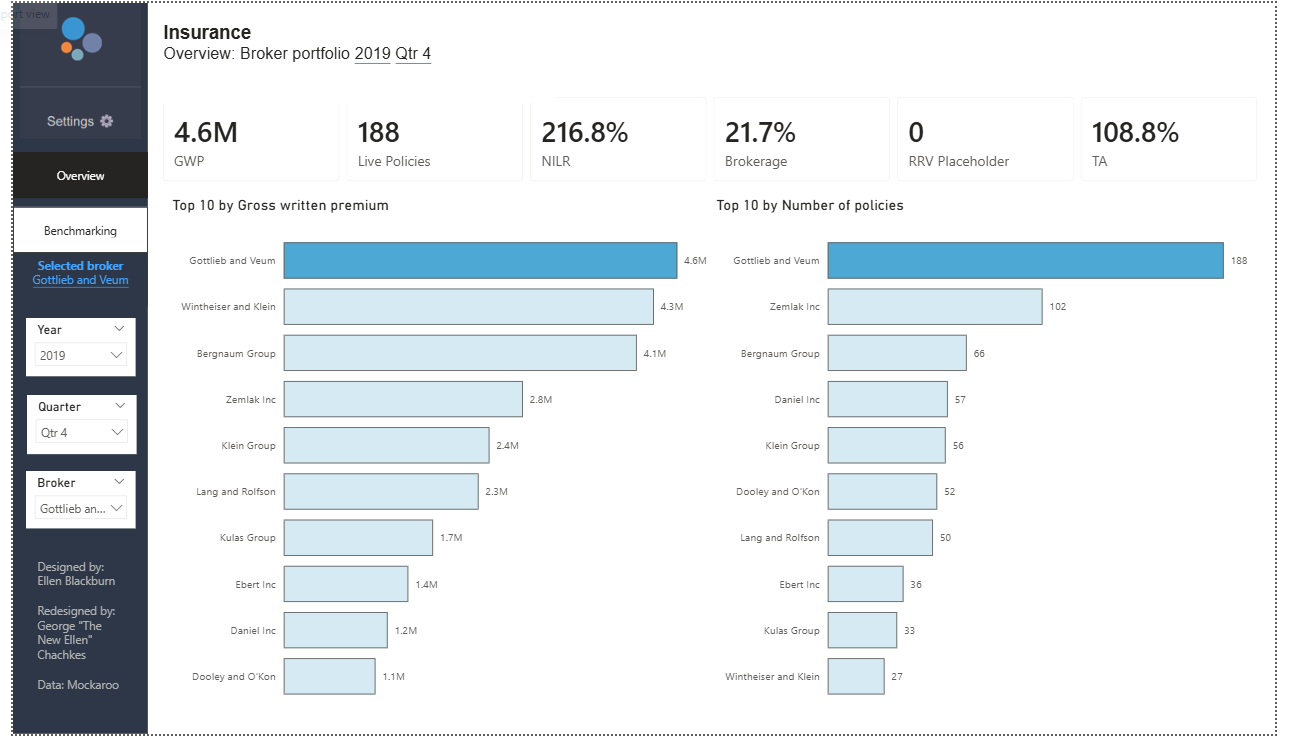
There are a few big differences between Tableau and Power BI that made the migration difficult. In Tableau, it is very easy to create a parameter for a selected Broker and have it filter some charts and highlight others. In Power BI, the default functionality is to have a slicer that filters everything. Building workarounds for all the bar charts to change that action to highlighting took up a lot of my time. I also struggled to migrate the year over year comparisons. In Tableau, it is easy to add them to a different sheet and put them under the KPIs. In Power BI, I was not able to figure out in the given time period which chart type to use to include both the KPI number and the YoY calculation. Given additional time, I am confident this is something I would be able to include in the migration.
Today was a fun exercise in completing a request that is very common amongst real like clients. I'm looking forward to what tomorrow, our final day, brings!