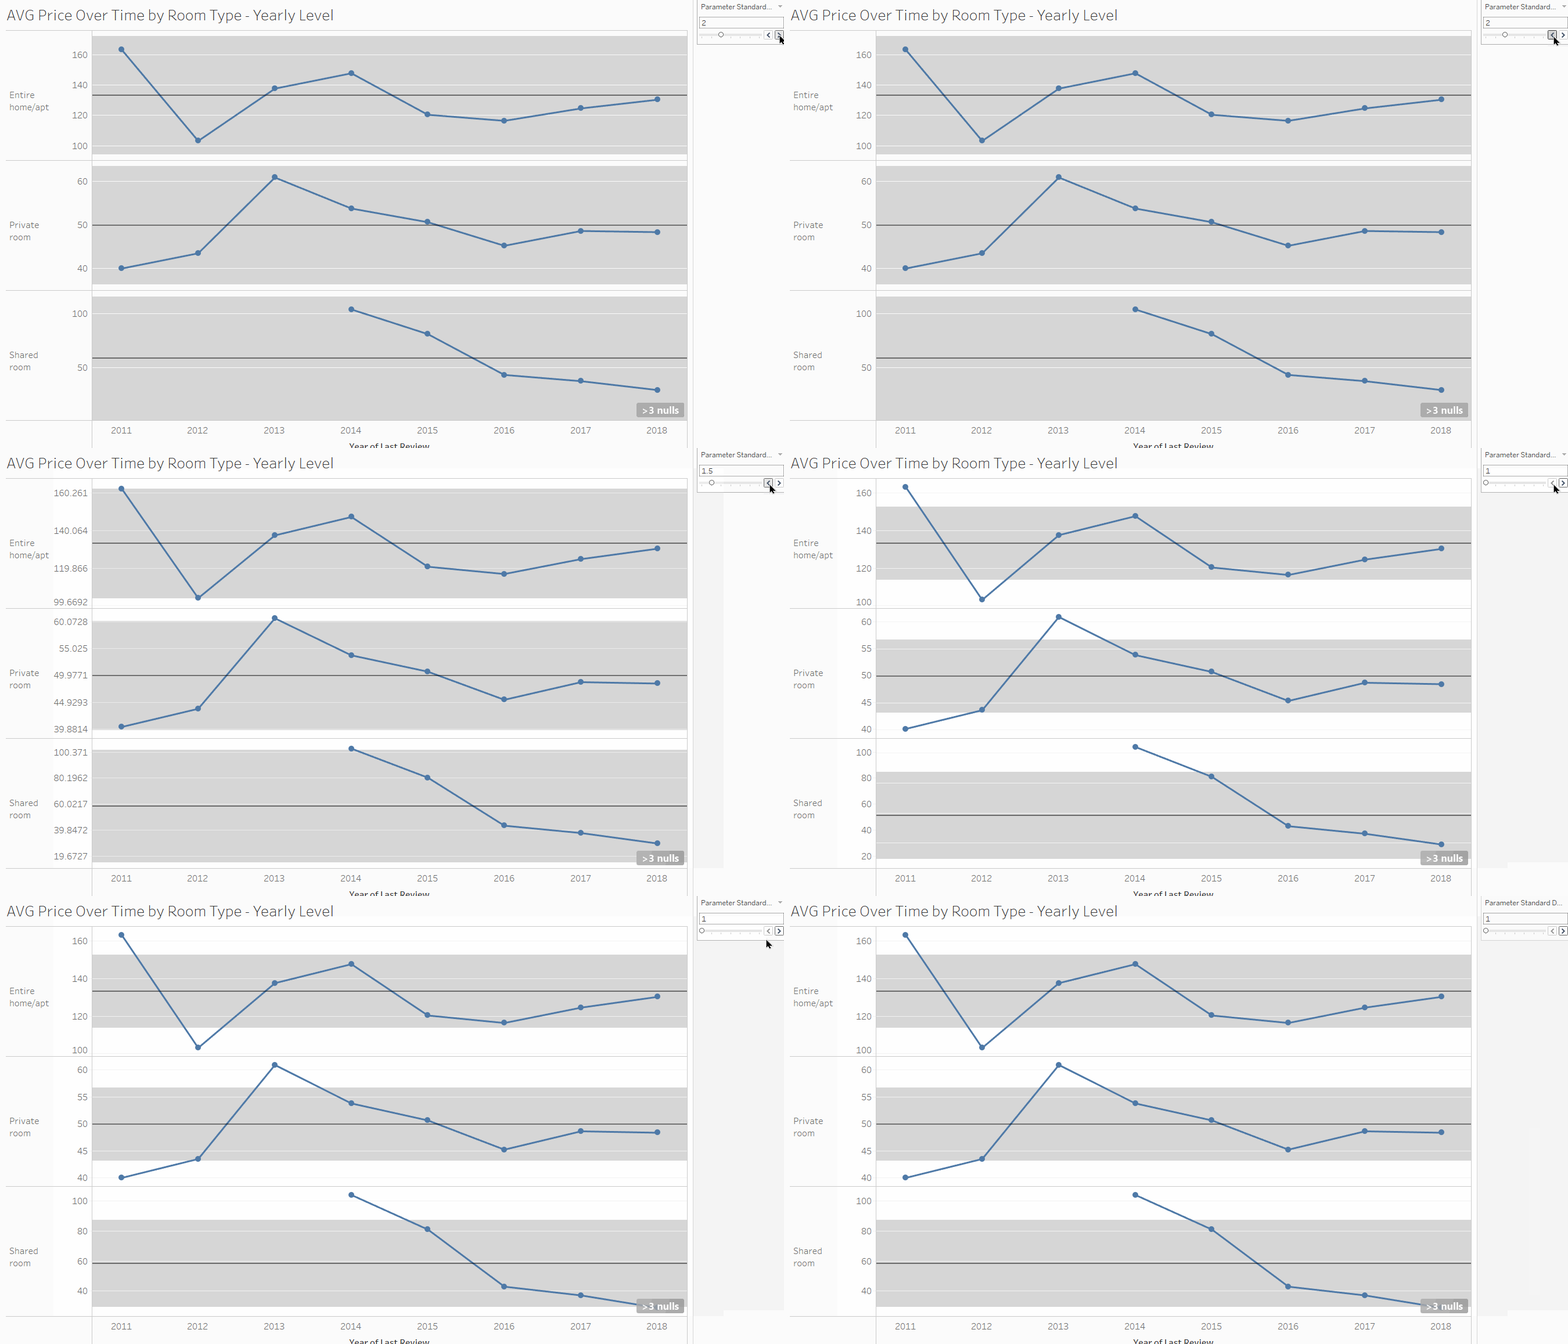
A control chart can be very useful to analyze the performance of a variable over a period of time. It's a type of chart that uses standard deviations above and below the mean, and allows you to spot any outliers that lie outside the bands created around the mean.
Control Charts are made of 3 parts: the distribution band (within the distribution, Upper Bound, and Lower Bound), a line chart and a circle chart.
For this example I will use a dataset that looks at the price data on London AIRBNB Listings between 2011 and 2018.
First we want to drag our dimensions and measures of interest into the view. To create a time-series analysis we will need to create an axis with the dates - so Right click on the 'Last Review' dimension and drag it to the Columns shelf. Once you do this, a window will pop up with different options for you to choose how you want to visualize your date field.
For this example, we will use the continuous Year.

For the Rows shelf, we will use the dimension 'Room type' to split the view into 3 categories, and measure 'Price' (Average).

To create a line chart with a dot for each year, we will have to create a dual axis using the AVG(Price) . One way to do this is to duplicate your AVG(Price) pill into the Rows shelf.

After you synchronize your axis, go to your second mark card and change it to a circle.

Next, we want to edit our axis - In the Edit Axis window - untick 'Include Zero' and choose the 'Independent axis ranges for each row or column'.

You're now left with your initial view:

Now let's create the calculated fields for the distribution band.
To create a dynamic control chart - we first need to create a parameter for the Standard deviation that will allow us to adjust our Upper and Lower Bound

Next - create a Window Average Price calculation (this is similar to an Average Line in the Analytics Pane), and a calculation for your Standard Deviation. We will need these to later calculate our Lower and Upper Bound.


Next we need to calculate the Upper and Lower Bound


Now that we have our calculated fields - let's build the control chart!
In order to use these calculations, they need to be in the view. Drag the Lower Bound, Upper Bound & Window Average Price to Detail Shelf in the 'All' Mark card.

Next - go to your Analytics Pane and Add a Reference line for the AVG(Price) for each pane.

Once you added the reference line (mean) to each category, you will then need to add your reference bands for the Upper and Lower Bounds. To do this, drag a Reference Band for your AVG(Price) for each Pane.

Now you will need to configure the band using your Upper and Lower Bound calculations as shown below:

This will create a Control Chart that will look like this:

Let's add the Parameter for the Standard Deviation to the view :

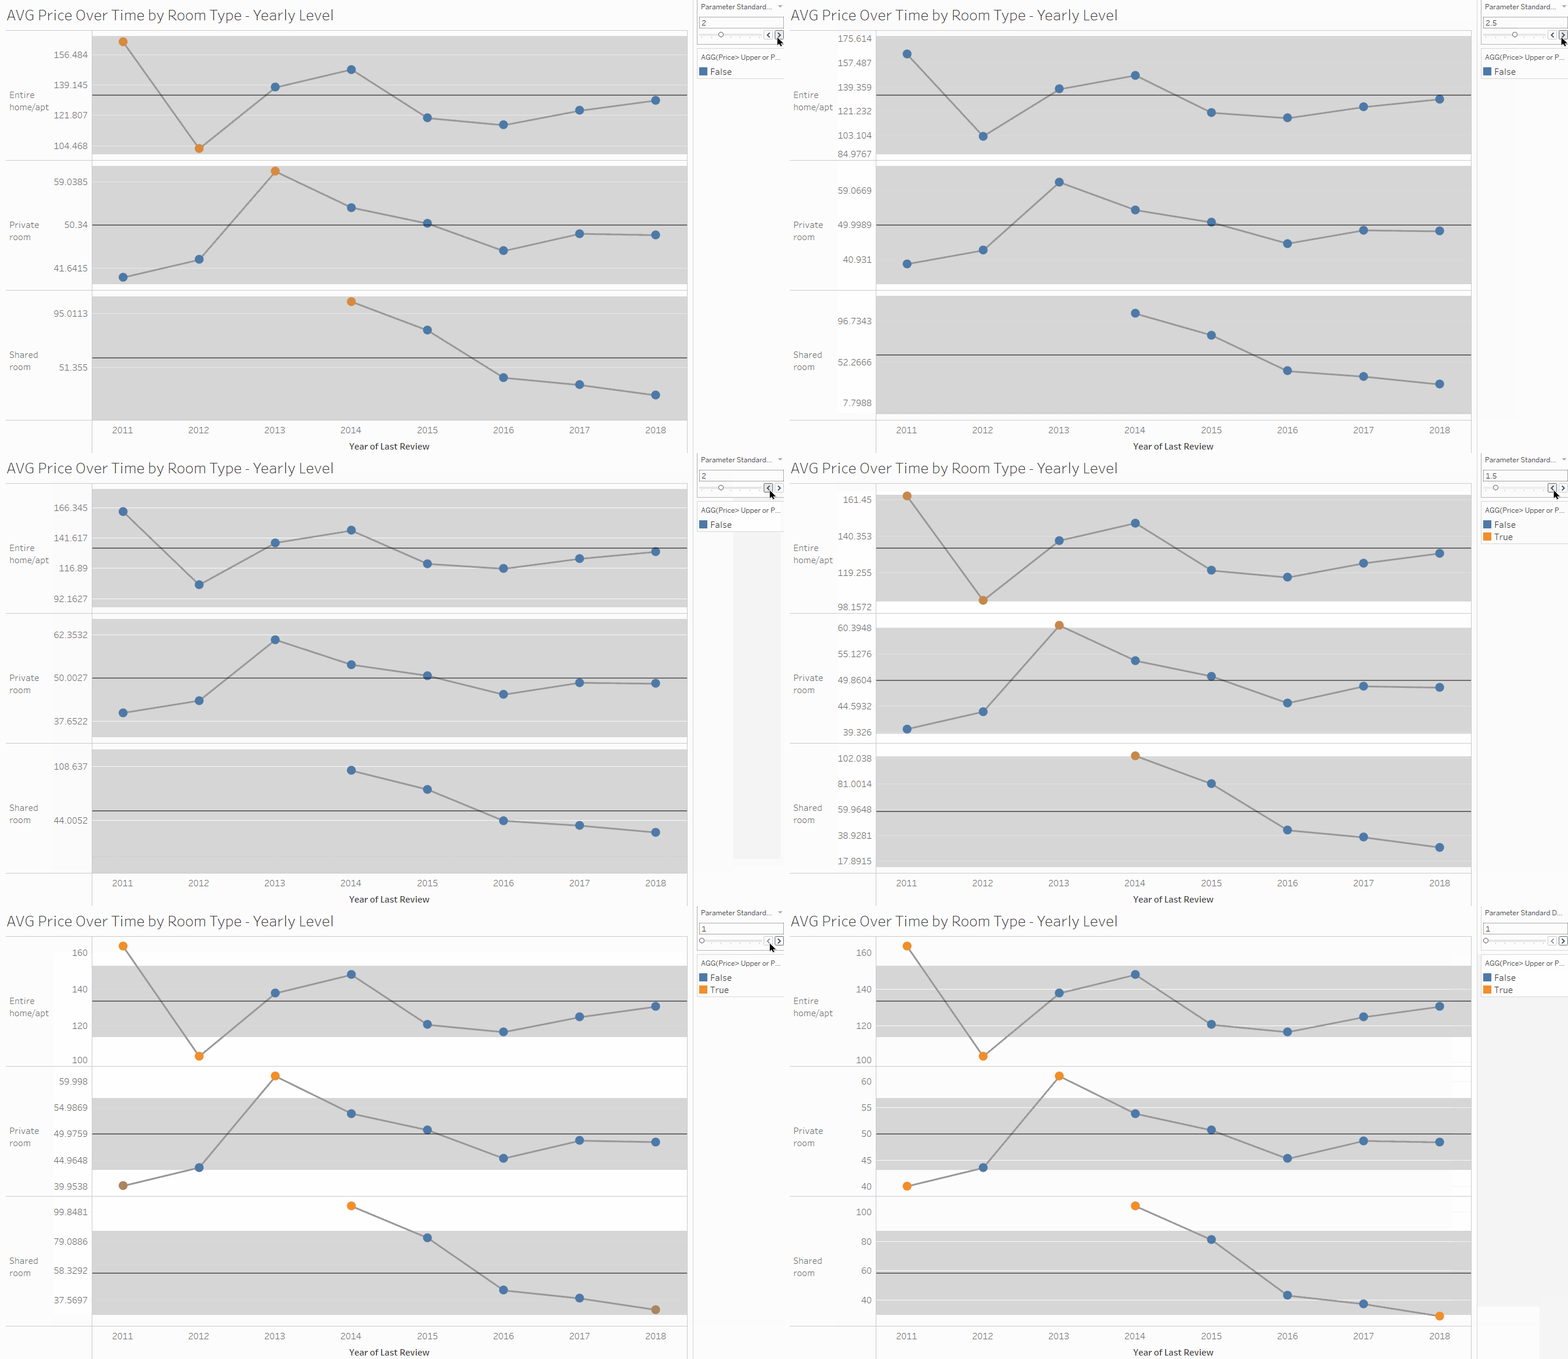
So now you created your Control Chart and can see that there are some values that are outside the bounds; As you adjust your Parameter value, you will see that it can get difficult to tell whether a value is an outlier or not. This is where the next step comes in handy (it should always be done when creating a Control Chart):
Create a calculated field that tests whether a value lies outside the Bounds - this will dynamically adjust as you interact with the parameter.

Place this calculated field on the Second Marks card on Colour (for the dot chart) . Once you do this, you can go back to your parameter and adjust the scope for outliers and see how your chart changes accordingly!

Hope you found this useful!
