


The Tableau Server repository is a PostgreSQL database that holds information about all user interactions, extract refreshes, domain details and more. Accessing the repository and using the data in it helps better understand Tableau Server Performance, user and workbook activity, and more.
To practice my understanding of the Tableau Repository, I created a dashboard from the Workgroup PostgreSQL database that holds the tables and views used to track the user activity in The Information Lab Tableau Server. You can check out the data dictionary for the tables and views created from the Workgroup PostgreSQL here . This should give you an idea of what kind of information goes into this database.
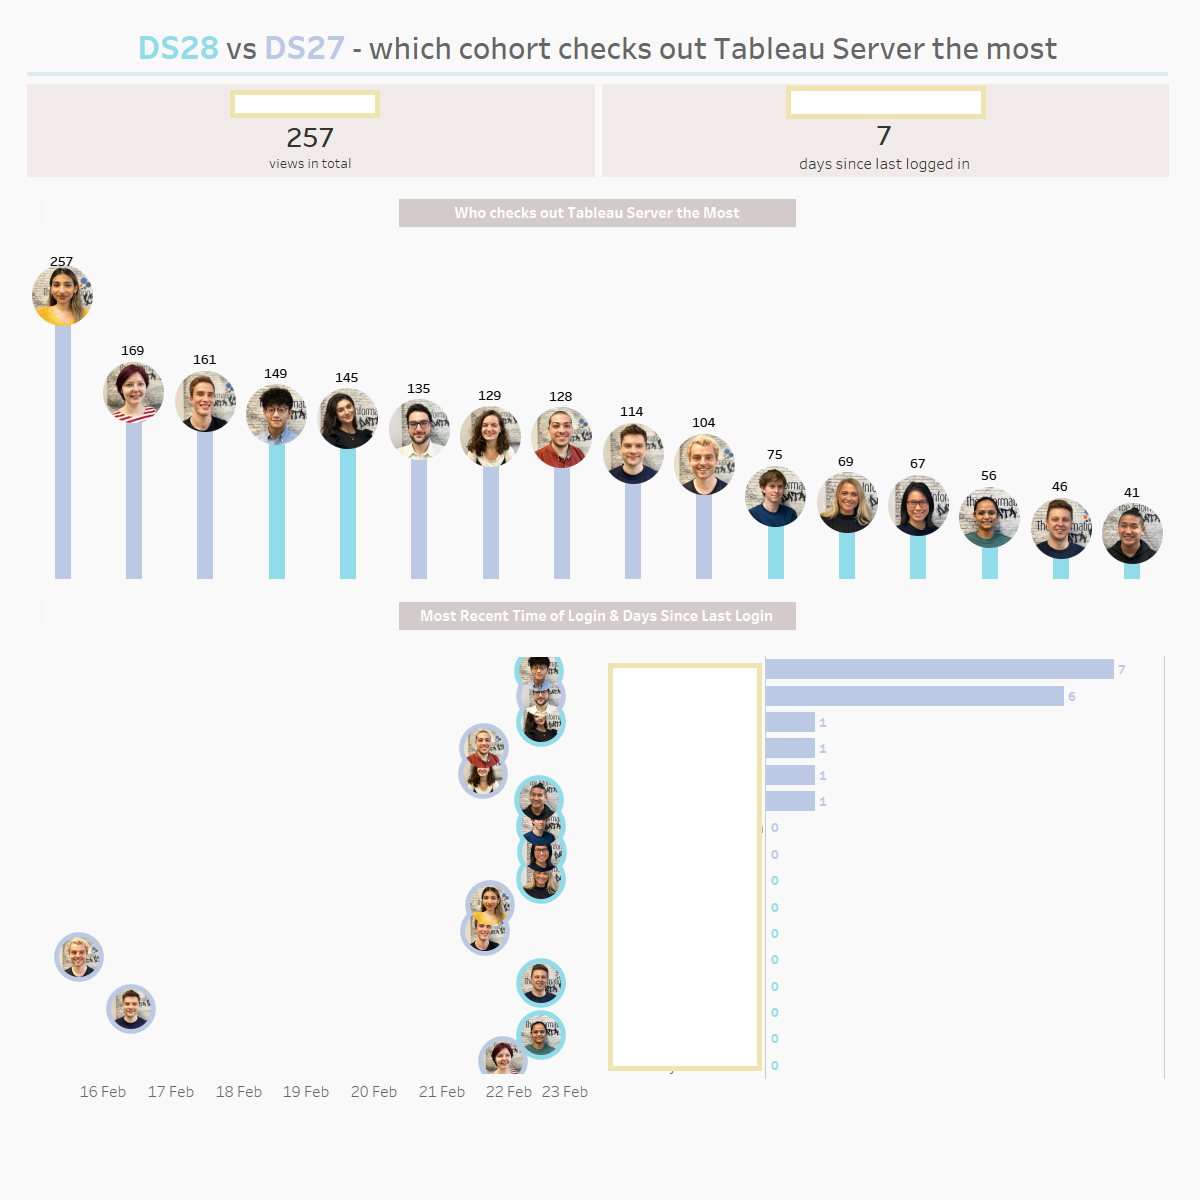
I decided to look at the data for my cohort, D28, and DS27 and compare across them the number of views per person (how many times a user has viewed a workbook within our Tableau Server) and the last login dates to Tableau Server.
Have a look at how often DS28 and DS27 checks out our Tableau Server! (the white boxes are used to hide names)
Once I publish the workbook to our Tableau Server, the dataset will automatically update and the workbook can be used in the future to keep track of user activity for Cohorts 27 & 28.