This blog serves as documentation for DS28's Tableau Prep project.
The datasets used in this flow look at UN global Refugee statistics, number of active conflicts around the world and resulting deaths, and coordinates data for each country. The purpose of this flow is to combine different datasets that are relevant for organizations in the humanitarian sector like NGOs in refugee protection for example.
Datasets:
UNHCR Refugee Statistics: UNHCR - Refugee Statistics
Conflict dataset: UCDP Dataset Download Center (uu.se)
Coordinates dataset: https://public.opendatasoft.com/explore/dataset/countries-codes/table/
We have our refugee statistics that show how the number of refugees have changed over the past few years in countries across the world; However, It would be really interesting to see what was cause some of the mass migrations. This is where the conflict data comes in useful and needs to be accurately joined to our Refugee statistics. The joint data from these files could help keep track of the situation of conflicts across the world - measured in number of deaths recorded as a result - and also help understand how the magnitude of these conflicts impact the numbers of refugees from a particular country.
More areas where this joint dataset could be useful:
- the joint dataset could be helpful to point to NGOs what countries need more focus
- judging from historical figures, see what countries people tend to go and seek asylum most; prepare these countries to have the necessary outreach
- Forecast the number of refugees based on magnitude of conflict
- Is the situation of conflicts getting any better? Is this impacting the number of refugees?
Now why do we need to join these datasets with a Coordinates file?
- The reason I did it in this workflow is so I can later visualize the journey of refugees from their country of origin to the countries of asylum. ( This is being done in Tableau Desktop by using the MAKELINE() function - this will create a line on the map between the coordinates of country of origin and country of asylum)
Next, let’s talk about the workflow itself and I’ll talk you through how to use it.
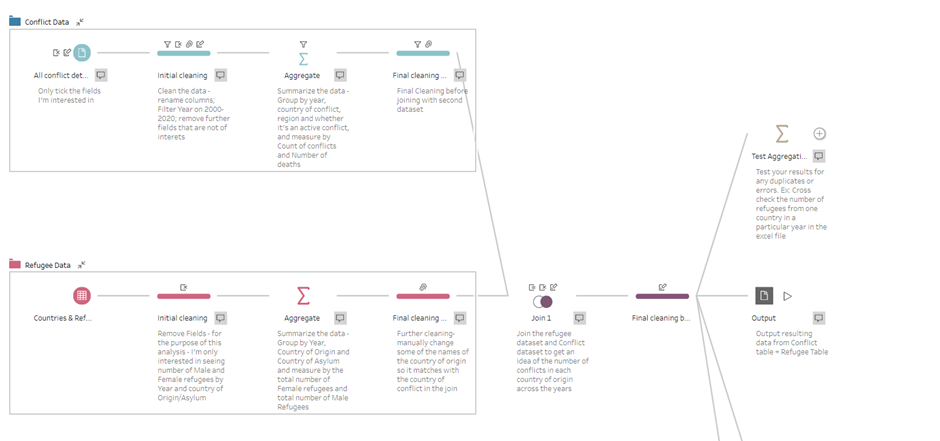
The first output comes from the first two datasets: The Conflict dataset and The UN Refugee Statistics. The first thing to do when you connect to a dataset (if it’s an Excel file) is to use The Data Interpreter – this will dynamically name the headers with what’s the correct name in the rows. For example, if your file comes in a format like the Excel file below, Tableau Prep will automatically deal with the issues of matching the headers to the right rows.
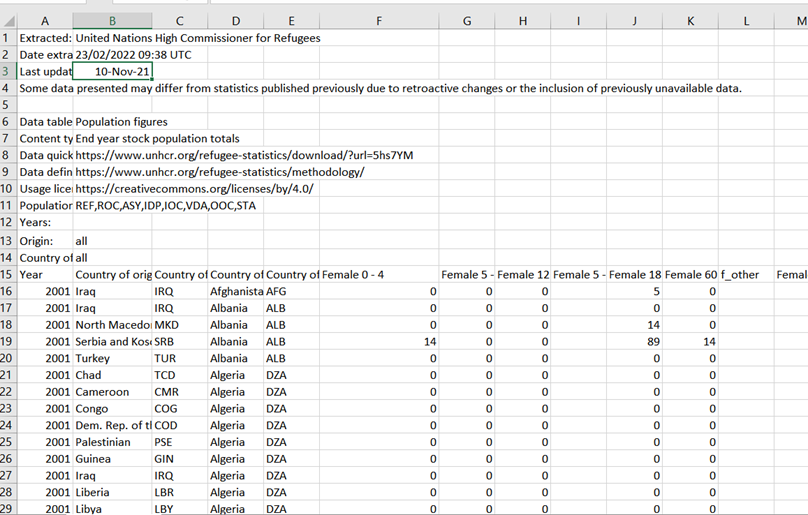
Next, add one cleaning step per each input. In this step I usually remove any columns that are not useful for my analysis. Filter the Date field for the period between 2000-2020 so we get a more compact dataset. After removing some columns, I am only left with information about the year, country of origin, country of asylum and 2 columns for their ISO codes, the number of total male and total female refugees.
With the conflict data I remove quite a few columns. I used this data dictionary that helps to choose what fields you want to focus on.
The next thing to do is Aggregate your data. You only want one row per each country of origin, country of asylum and year. So in your Refugee data you will want to group by the country of origin, country of asylum (and codes) and the year, and measure by total number of female and male refugees.
You do a similar aggregation with the conflict data – you group by country, region, year and whether it’s an active conflict, and measure it by the count of active conflicts, sum of best and highest estimation of deaths.
Now that you have your aggregated data, we’re ready to join it together. But just before that, you can add a cleaning step and just rename some of the columns if you wish, or just remove some.
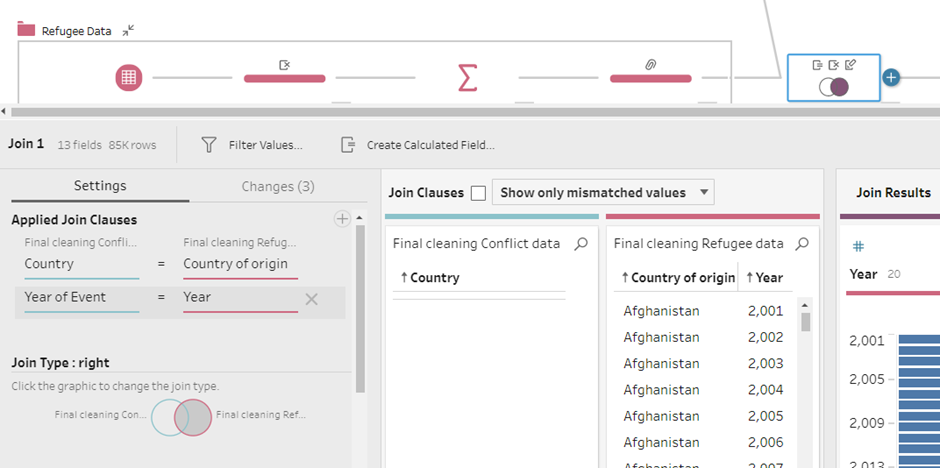
We will do a right type of join on the fields in screenshot below. We do a right join because our main interest is in the Refugee data and we want to add additional data to it- by doing a right join we make sure we don’t lose any of the rows that are mismatched.
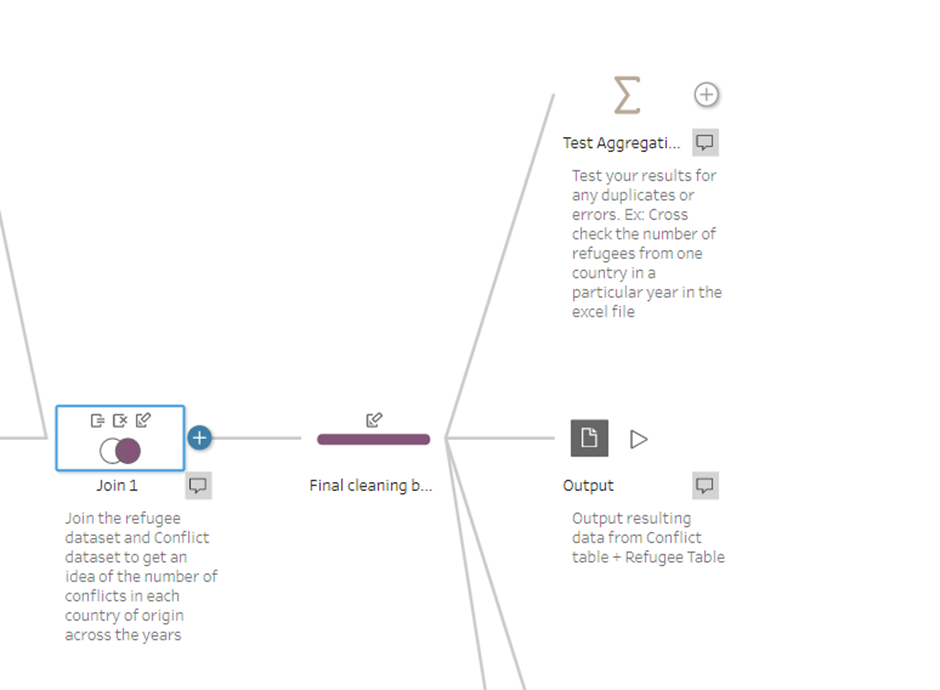
After joining them, we’re left with just under 85k rows. After doing some final cleaning (removing unwanted columns, renaming fields), one step that I advise you to do before outputting the result, is to add an extra Aggregate step to test whether the data coming from your join is correct. I usually cross check with Excel some random values for a specific dimension. After I made sure everything was correct, I outputted the combined dataset.
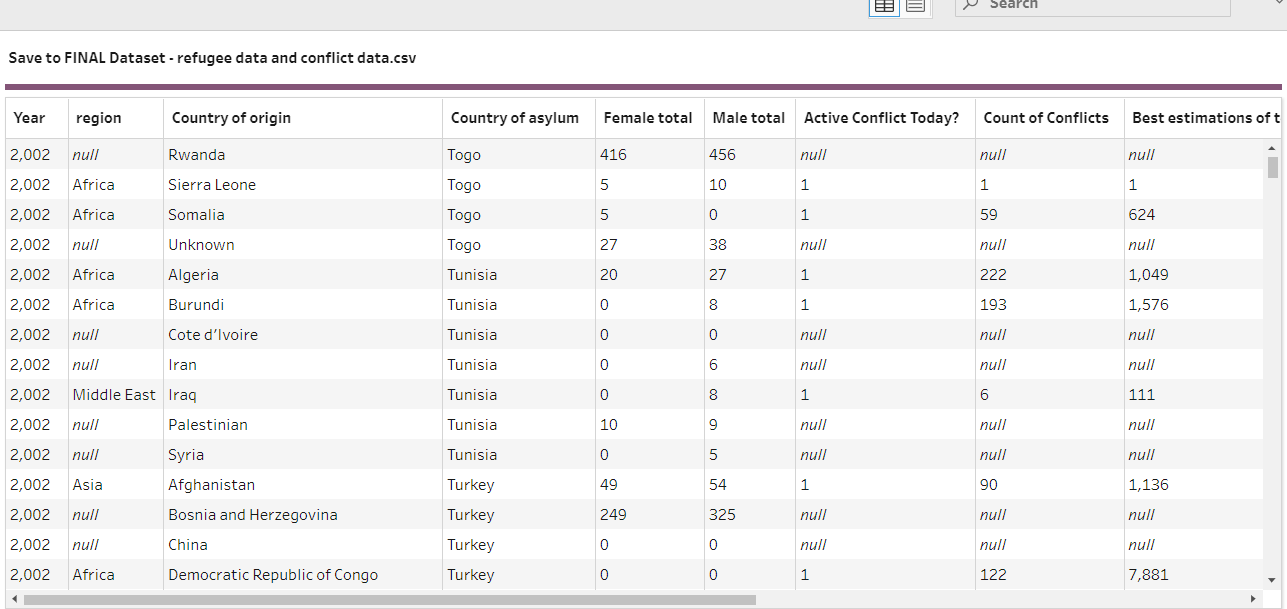
The final dataset will look something like this. The Nulls are there for countries where there's no record of ongoing conflicts. If you remember, we did a right outer join to include all data from Refugee Statistics and match against anything that exists in the Conflict data.
The last bit is as I mentioned at the beginning, focused on adding the file with the coordinates details.
We will need to have the Lat and Long for both country of asylum and country of origin. In this case we will need to have two separate joins with the clean step before our output.
In our first join, we want to have an Inner join on the Country of origin ISO and Country Code and in the second inner join – Country of asylum ISO and Country code.
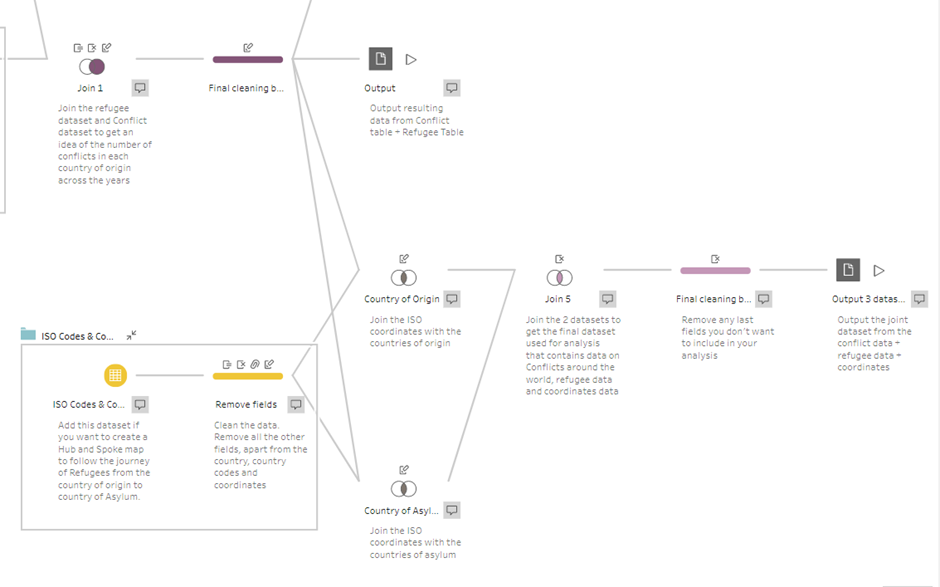
Now you need to combine this two joins – you do this by adding an extra join from the two previous ones. You will need to configure it as follow:
Country of Origin ISO -Country of Origin ISO
Country of Asylum ISO -Country of Asylum ISO
Year – Year
Basically – match together the same fields from the two joins. The last bit before you output your data is to do some more cleaning, again rename some fields and remove the ones you don’t need.
And voila! This is the flow:
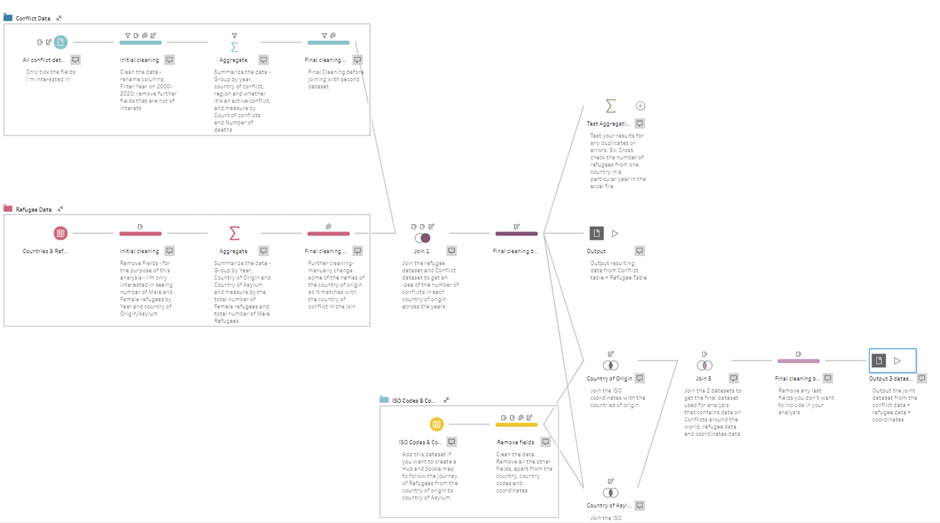
Now that you have your combined, cleaned data set, you can input it in Tableau Desktop and build your analysis with it.
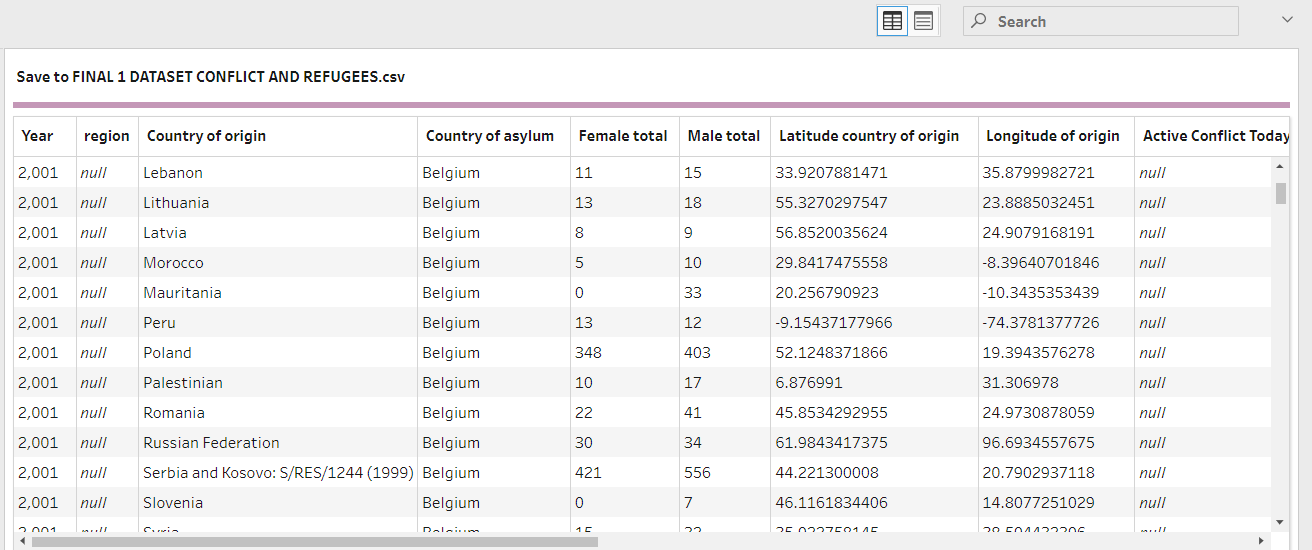
And this is the final output from the 3 datasets joining.
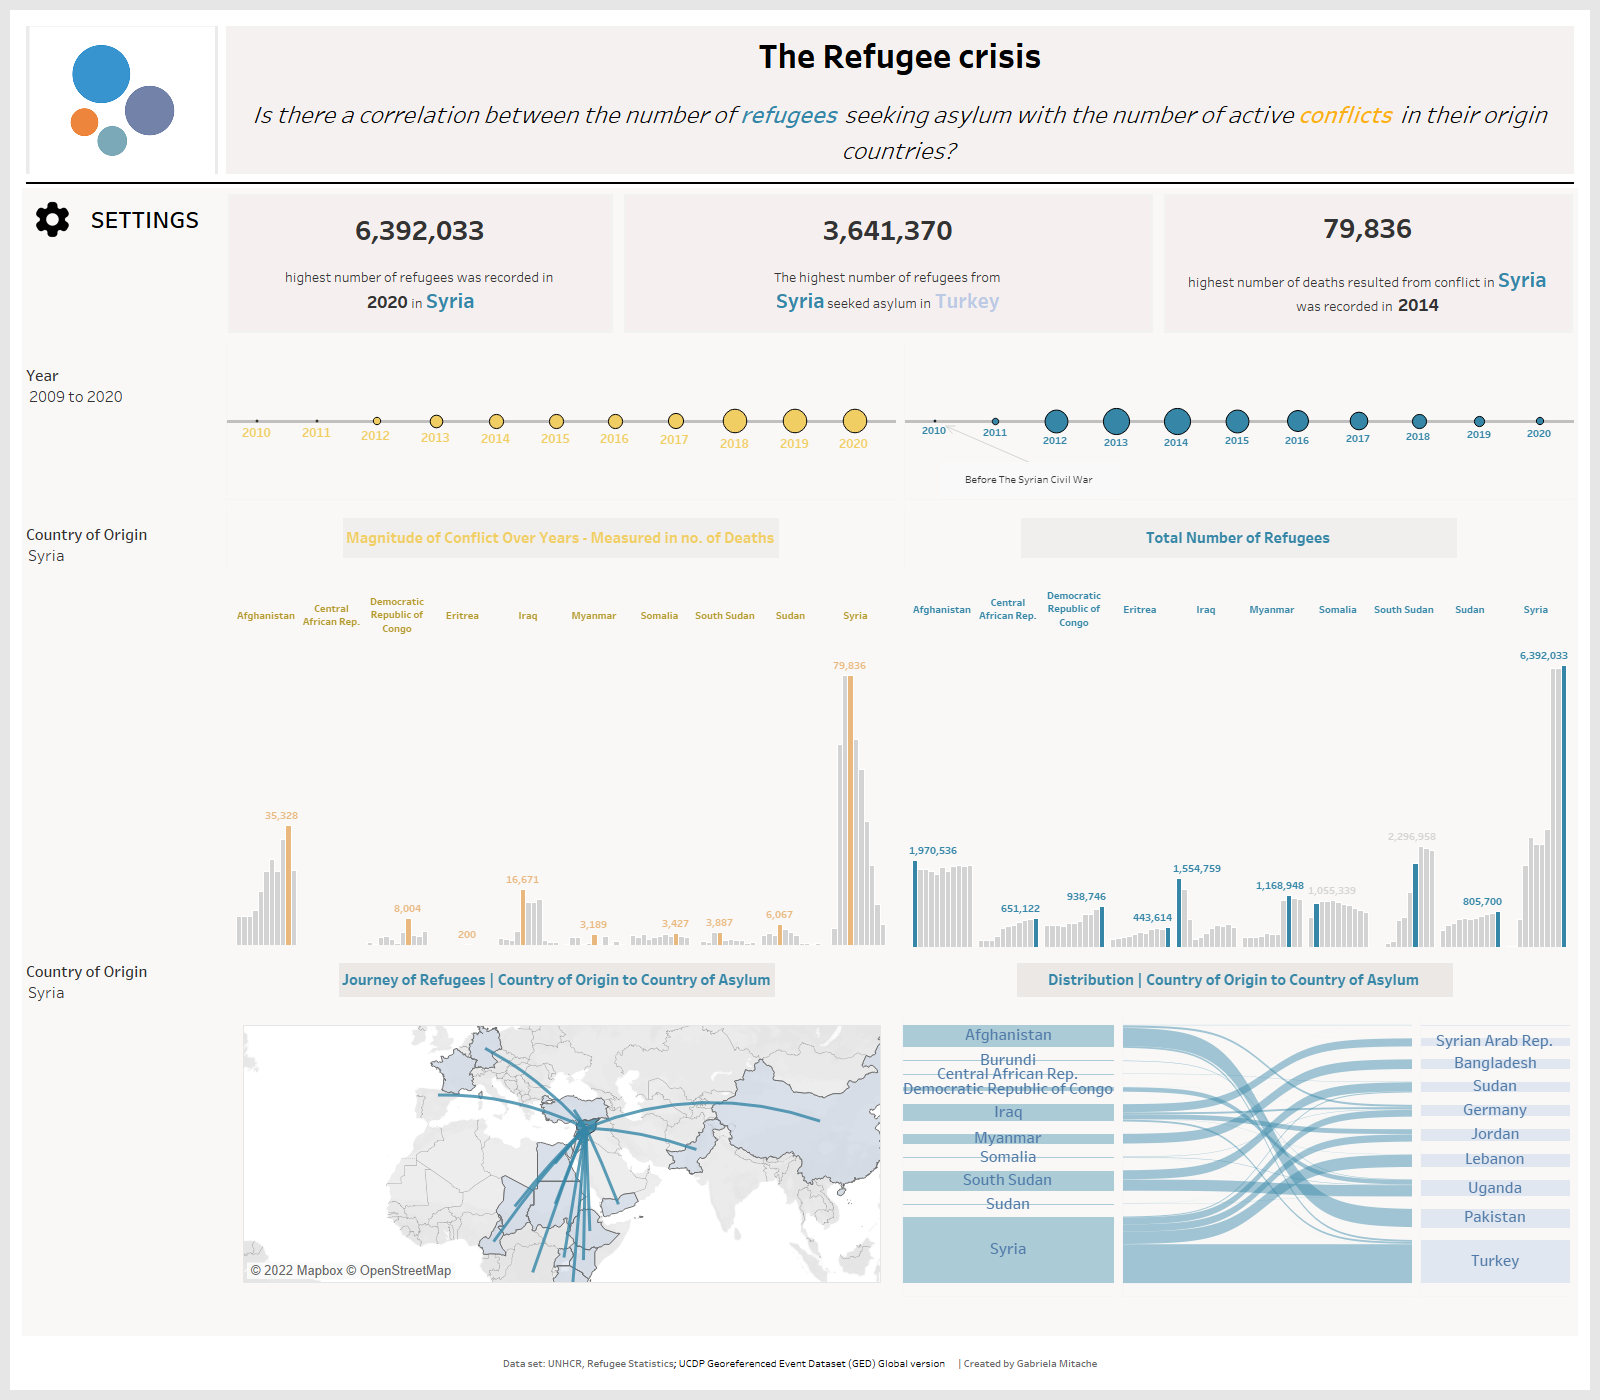
For example, this is what I built with the dataset - It answers the question of when the highest number of refugees has been recorded over time, which country of asylum the highest number of refugees go to and also, what was the highest recorded number of deaths resulting from conflicts.
Link to dashboard on Tableau Public:
