For the fourth day of dashboard week, DS28 had to visualize historical results (between 2014-2021) from the London Marathon.
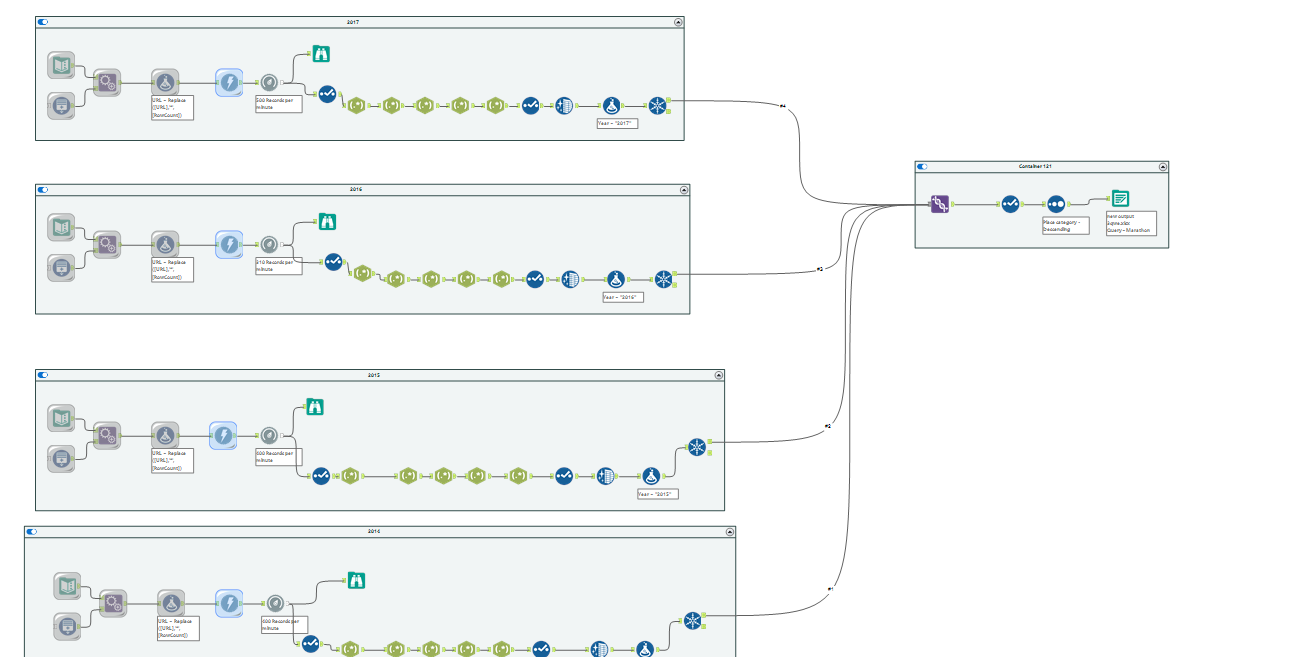
The data can be found here. To get the data needed to create the dashboard, I first had to go into Alteryx and by web scraping the website, take the relevant information out.

After parsing out the data for each year, I decided to go ahead and output only 4 years for my analysis (2014-2017).
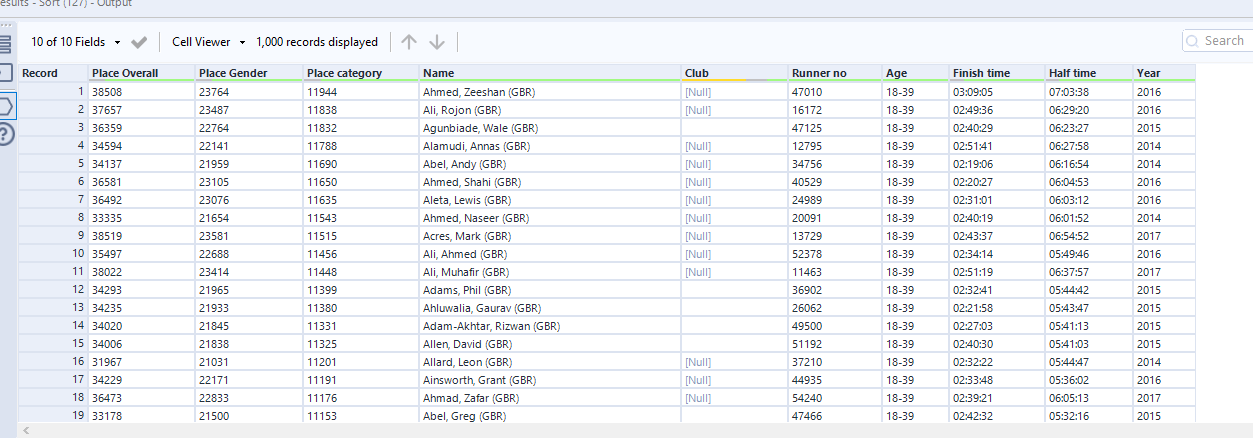
This is how the data looked initially:

And this is the final output after using Union to add together the data from the 4 years:

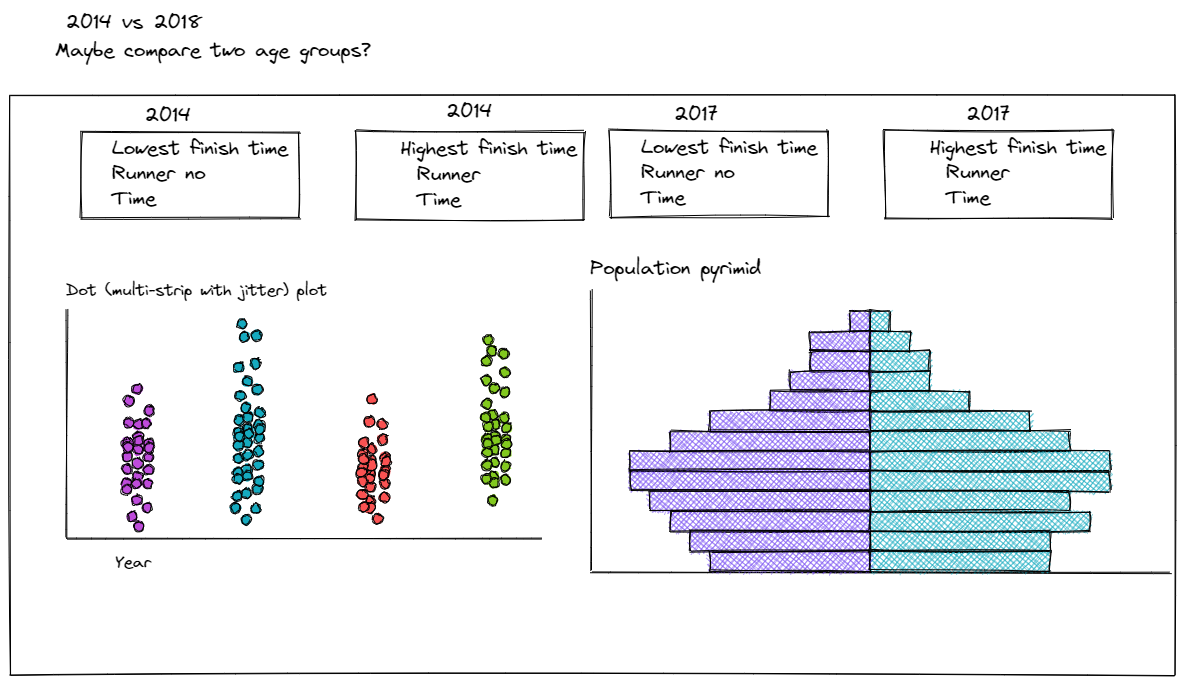
Now that I had an idea about what's inside my dataset, I went on and created a quick sketch about the things I want to visualize:

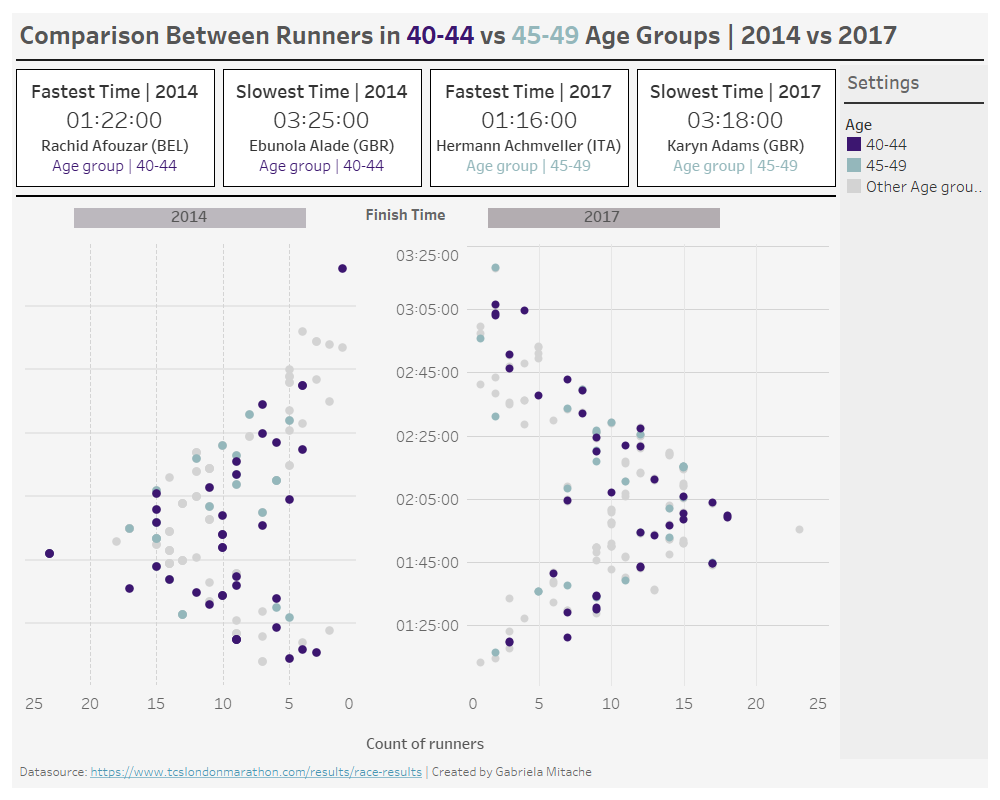
In the end I focused my analysis on two age groups and compared the finishing times between them across 2014 and 2017.
Here's my dashboard for the day - I can't say I'm the happiest with the result, but I am quite happy I got to focus more on the data preparation side in Alteryx

