Today we’ve been tasked with major league baseball statistics. All game logs from 1817-2017 had to be inputted from retrosheet. The team split up and tackled the problem of importing all the XML files from different angles. Our biggest issues were matching headers with the corresponding values from the data dictionary. The structure of the data dictionary meant that there was no direct link between the unique code and the value. Although I tried to solve this problem in Alteryx in a more automated way it seemed that manually creating a better-formatted dictionary was quicker.
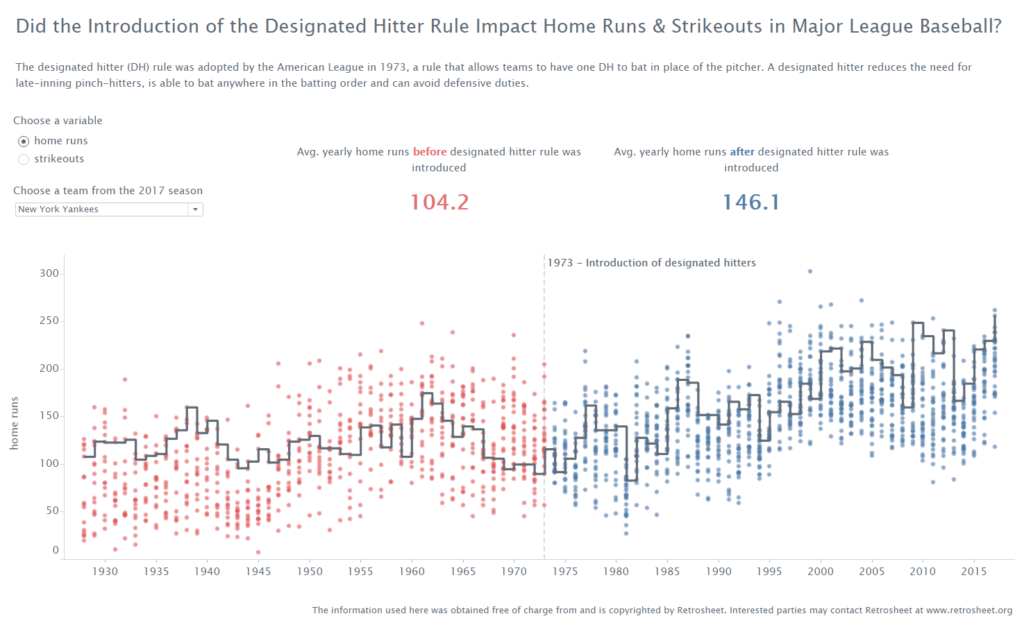
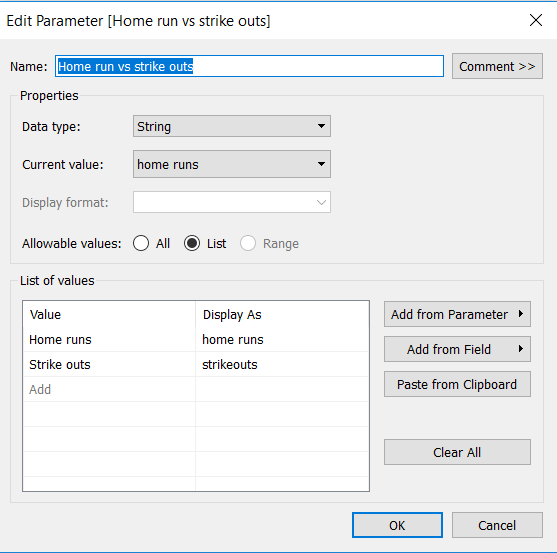
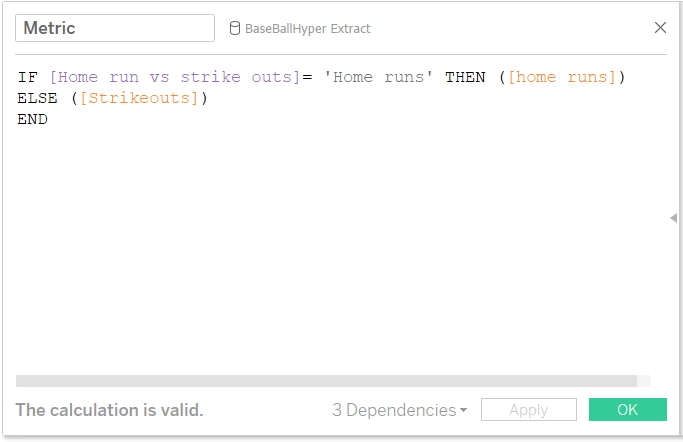
Exploring the data in Tableau was interesting as I had no idea what most of the statistics mean. Eventually, I decided to focus on home runs and strikeouts. Andy pointed out to look at a major change in the baseball rules in 1973 to analyse the effect of the designated hitter rule before and after the introduction of the rule. I ended up creating a view with two parameters complementing each other, one to change the metric (home run or strikeouts) and the other was to highlight a team throughout my timeline.
A quick way to create a metric function is to set your parameter like below.
You can then create a calculated field to link your parameter values to your measures.
Check out the viz to see it in action!