To use multiple sheets, maybe from different data sources, in a single visualization Tableau offers different ways to do so. The way to combine the tables has to fit to the according data within and might get a bit complicated from time to time.
The Tableau Data Model specifies how you can link different tables to each other. You have to be aware of the structure of the data so you don’t mess up what you get out of it in the end. There are four different ways how tables can be connected with each other in order to work with them and let the data of different tables interact with each other.
Union
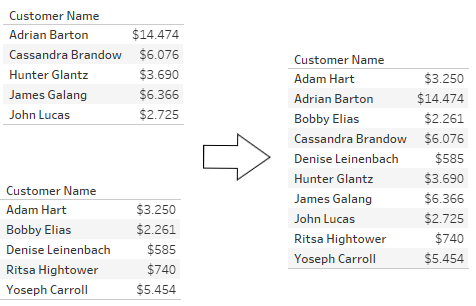
Unions are the most basic way to combine two tables. The second table just gets stacked onto the first one. So if the data is structured the same way and uses the same columns and names you can just stack the tables on each other.

Join
If you have one column in both tables which contains the same information, you might want to join them together. A join works at a row level and combines every matching row record and then pastes the columns of both tables together.
If you would want to combine two tables which follow the same logic, but don’t have the same columns, a join is a good idea.
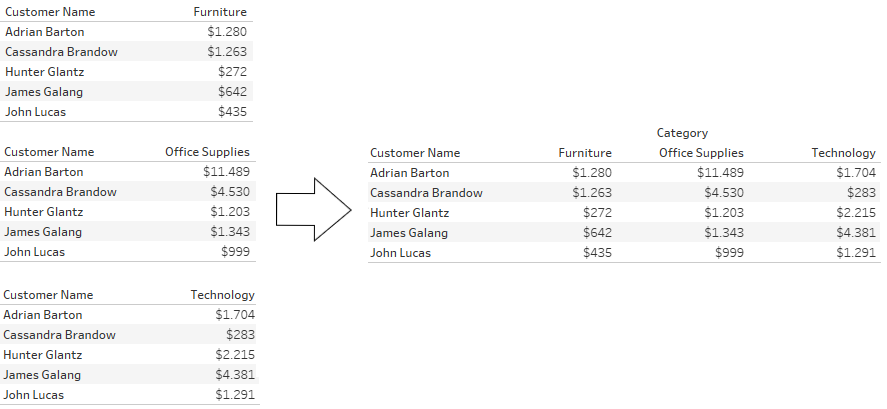
See the example below. The sales of different segments for the same customers are stored in three different tables. With joining the tables based on the customer names the data can be combined quickly.

Things will get more complicated when the two tables contain values that match the criteria and also some other values that don’t match the criteria. If one table contains names that cannot be found in the other table, you need to think about whether you want to keep those values or maybe not.
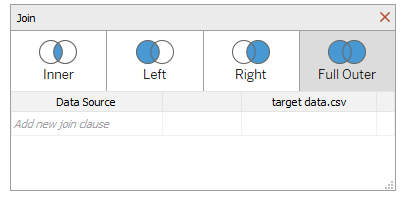
Here Tableau shows the Venn diagrams that help you quickly understand what is included in the final table, and what is not. You can choose between the four different join types (inner, left, right and full outer) and thereby tell tableau whether to only keep exact matches, keep the exact and all unfitting values from the left or the right table or just keep all information, regardless if it matches or not.

You should always keep an eye out for the size of the final table. If it is much bigger than the original tables, it is very likely that you did something wrong and should definitely check it again.
Relationships
Relationships are the way to go if your data is a little bit more tricky. When your data is on different levels of aggregation a join would just multiply many values and you would run into many problems soon. Relationships can be viewed as the smarter variant that can manage more complex issues.
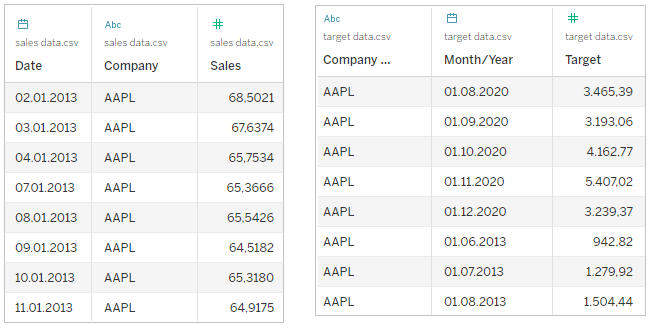
If we want to combine two tables, but one contains one row of data for every single day, whilst the other table just contains data for every month, a join would cause problems. If we tried it, every single day within a month would get the value of the second table assigned to it. That’s where relationships come in. With relationships it is possible to connect the two different tables, but unlike with joins or unions we actually do not create a new table. We do just create the linking and the relation between the two. That’s why the product of a relationship is called a “logical table” and is not like the “physical tables” that are created via unions and joins.
So relationships really provide a smart workaround around a common problem, which would otherwise lead to many different problems.

Blends
Blends behave similar to Relationships, they are also used for data with different aggregation levels. But they do work with two separate data sources instead. The most common use case for blends would be if you want to connect a data source coming from a server and an external source which otherwise couldn’t be used together.
Here you can define the fields that link your logical table within each worksheet which grants more flexibility if you want to do different things across a single workbook.
Understanding how you want to combine your tables is key to working with them. Telling Tableau how the different tables relate to each other is fundamental to work with multiple tables at once. And if you connect them the wrong way, you might get the wrong results out of your analysis, even though you had the correct data. Luckily Tableau is very helpful in understanding and describing the relations within the tables.
