


The Tableau Data Model describes how you connect multiple data sources are connected. Here Tableau differentiates between two different types.
1. Physical Tables
Physical Tables are built when two or more data sources are connected via joins or unions. As soon as they are connected, we can see the number of rows/fields increase in the Data Source sheet. A Physical Table is built, which means that we can directly see its result.
2. Logical Tables
With Logical Tables, the Model becomes a bit more complicated. Since Relationships are a bit more advanced, they are not building an actual table. The Physical Table is built, once you put your Measures/Dimensions into the view. Due to this, you can not investigate your combined tables in the Data Source Sheet, as there is just a logical connection between those. Depending on what’s in your view, the table is built differently.
These two connection types happen on different levels within the Data Model, as shown in Fig. 1. The Logical Layer here is built of two separate Physical Layers with multiple tables. The other way around (Logical Tables building a Physical Layer) is not possible.
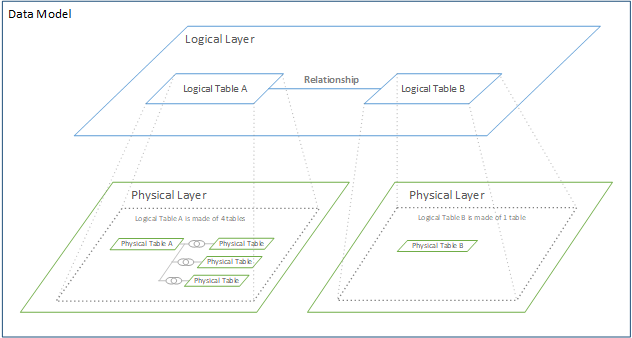
Figure 1: The Tableau Data Model. The tables in the physical layers form combined tables. These tables are then connected logically via a Relationship. Source: https://help.tableau.com/current/pro/desktop/en-us/datasource_datamodel.html
The advantages of using the logical tables over the physical ones are that you are more flexible, as the table is built based on the actual work you do. The major disadvantage is that your data gets more complicated, and you can not just look up single rows within your table.
If you want to read up on the different connection types, check out my old Blogpost Working across different tables in Tableau.