If you are working with Spatial Data, within Tableau or Alteryx, you have to watch out for a few possible stepping stones. One can occur when you try to create an output with an overlap over two different Spatial Columns.
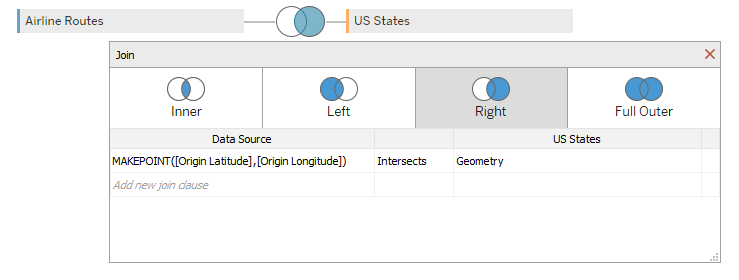
If you do this in Tableau, you would first connect the two different data sources to each other. Now you can do this using a join or a relationship, in either way you need to specify that you want the overlapping Data. So the condition on how the data is joined/related to each other has to be specified. Tableau offers the possibility to select “intersects” to just get the desired part when applying the connection to the data sources.


Now our datasets are limited to the rows that meet the joining condition.
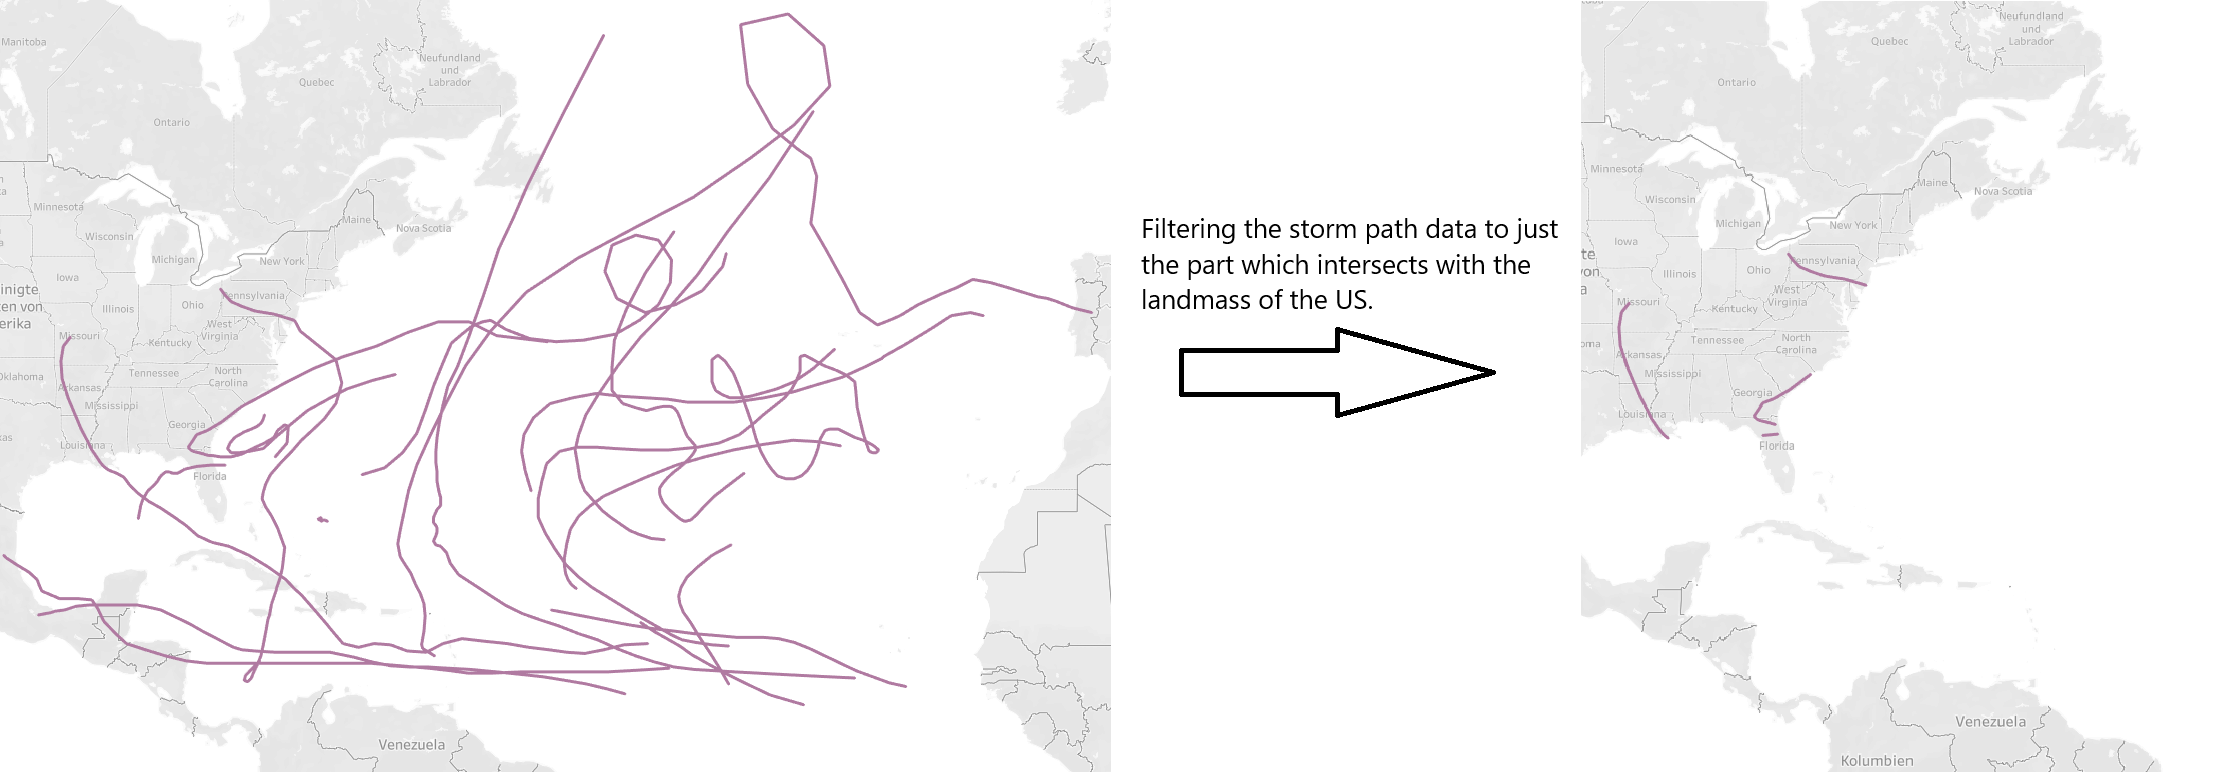
Let’s take a look of this in Action. Here we can see storms that appeared in the Atlantic Ocean in 2012. The lines indicate the movement of the storm over time. Our goal is to filter the view down to display only storms that have hit the US. Now once we connect our data to the spatial data containing the information about the area of the US, we are able to filter it down to just the storms that did hit the US.

Now this is great and sometimes thats all we need. But what if we want to keep the whole path of the storm while still filtering it down to the few storms which actually hit the US landmass? Now here is where Tableau is coming to its limitations.
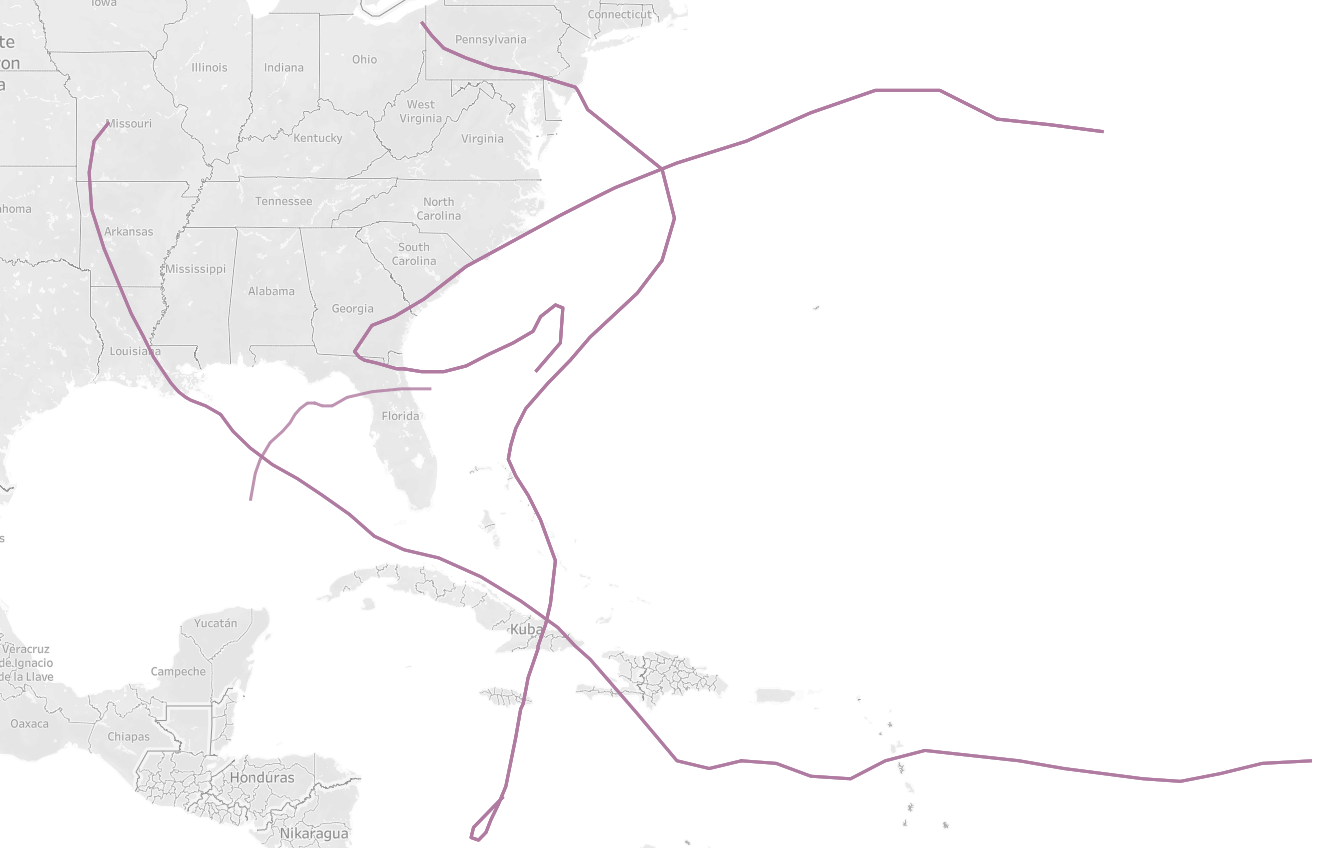
Alteryx is the tool to solve this problem. Here we can specifically filter the storms that hit the US, but we can still keep the whole storm path.
Our storm path consist of many Latitudes and Longitudes - one for each timeframe where the storm was monitored. In Alteryx we get the option to easily transform these corresponding Latitudes and Longitudes into spatial lines using the Poly Build Tool. Now every Storm can get its single row, containing just its total path - the amount of rows is decreased enormously. Next we can use the Spatial Match Tool. This Tool can take two separate spatial inputs – in our case the storm paths and the US area – and filter our data down to just the storm paths that intersect with the US - similar to what our join has done in Tableau. Now here we don’t loose the information about the Storm outside of the US anymore, because we have just kept one single spatial object per storm.

Now we can see that after the data transformation in Alteryx we can filter to just the storms that hit the US, but we still don’t loose the additional information about the path back on the ocean. This perfectly shows how well Tableau and Alteryx can be used together to get a desired outcome if one of the Tools fails to do it alone.
