There are some fancy Chart Types in Tableau. The Extended Bar Chart is one of them. The advantage of an Extended Bar Chart compared to normal Bar Charts is that you can display more text at the start of a bar.
Lately, I have written a blog post on how a coordinate system can be used to create custom visualizations. Extended Bars are built the same way.
The first thing you have to do is determine how many different points are needed to define the shape of the bar (Fig.1). Then you need to work out the x- and y-coordinates to calculate them for every bar.

|
Point ID |
X-Coordinate |
Y-Coordinate |
|
1/9 |
0 |
(H1+H2)*Index |
|
2 |
W1 |
(H1+H2)*Index |
|
3 |
W1+W2 |
(H3+H4)*Index |
|
4 |
W1+W2+W3 |
(H3+H4)*Index |
|
5 |
W1+W2+W3 |
(H3+H4)*Index-H3 |
|
6 |
W1+W2 |
(H3+H4)*Index-H3 |
|
7 |
W1 |
(H1+H2)*Index-H1 |
|
8 |
0 |
(H1+H2)*Index-H1 |
With:
W1: Width short bar; W2: Width bend bar: W3: Width long bar
H1: Height short bar; H2: Distance between short bars (not displayed in fig.1 as it is the distance to another bar); H3: Height long bar – This is your Measurement!; H4: Distance between long bars (not displayed in fig.1 as it is the distance to another bar)
Index: Index of your bar – I set it to be going from -Max/2 to +Max/2.
Besides H3 which is the measurement you choose – remember to scale it accordingly – all values can be chosen individually to meet your desires.
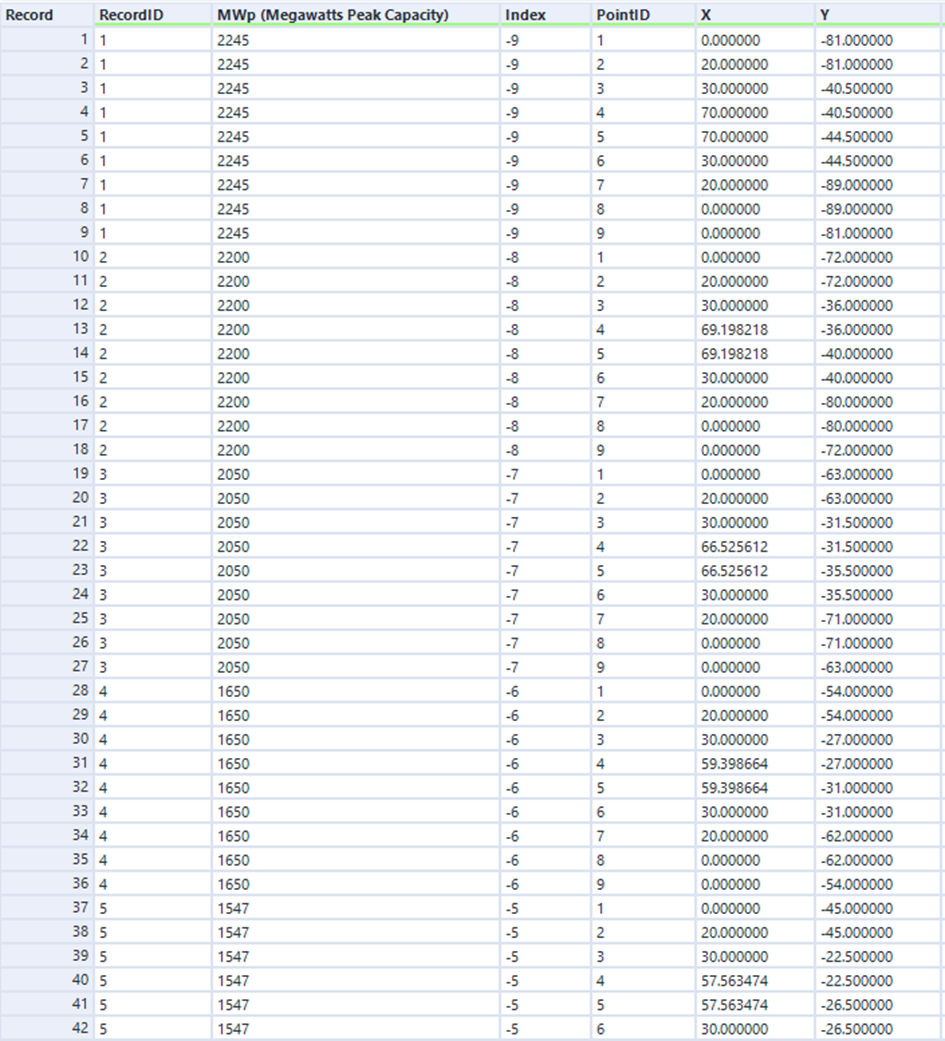
This data transformation has to be done outside of Tableau. I used Alteryx to do so, but you can also use Excel, Python, etc. The result should look similar to Fig.2

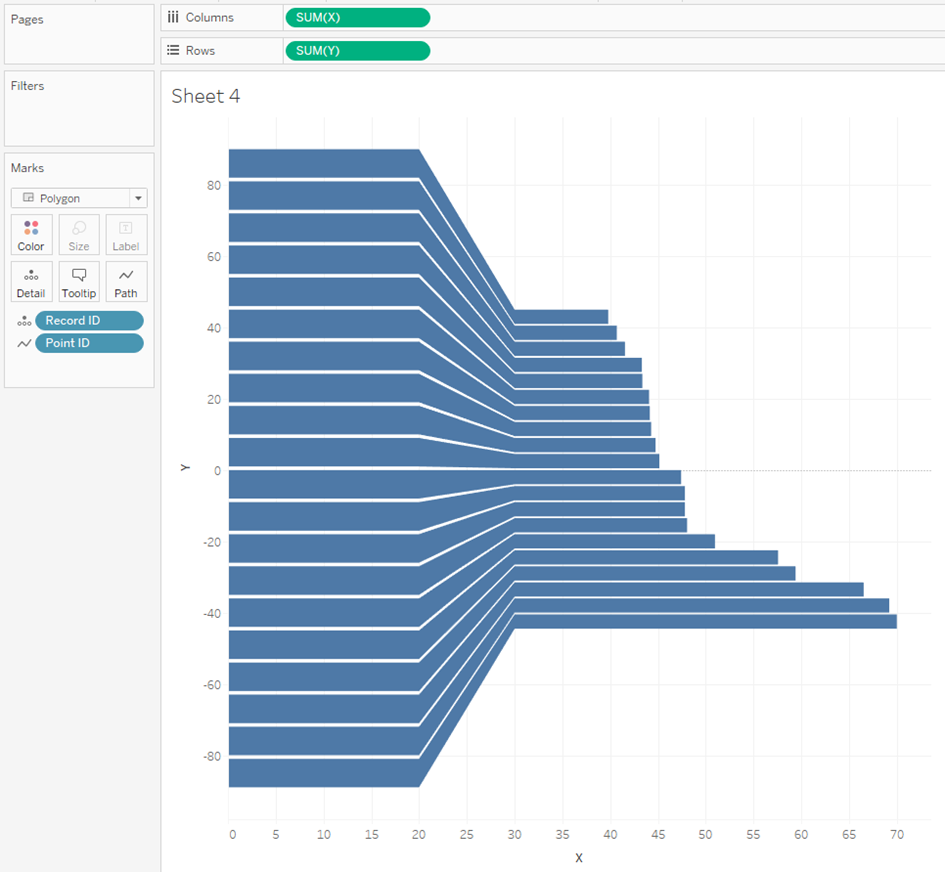
Once you are that far, you can load the data file into Tableau. There you need to place your X- and Y- Coordinate into rows/columns. Then choose the Polygon Type in the Marks Card. Once you put your “Point ID” onto the path, the shape should appear. Now place the unique identifier of each record onto details. You should end up with a Chart, similar to Fig.3.

Now you can add things like coloring and text – here you need a dual-axis! – and you are finished with your Extended Bars.
If you want to see how it looks in a completed Workbook, you can download my Tableau Public Viz.
