Drill Downs allow users to explore data in-depth. You can drill-down, drill-up, and expand features on visuals.
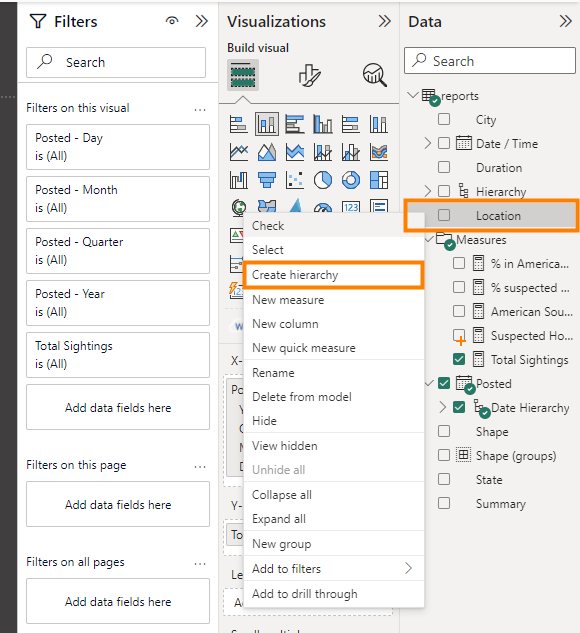
1. Drill Mode Requirements: To use the drill mode, a Power BI visual must have a hierarchy. Go to the Data Pane, right click the first field of your hierarchy and create hierarchy. For the rest of the fields that you want to add, right click them and Add to Hierarchy

2. Use Drill Feature: You can access drill-down, drill-up, and expand features either by:
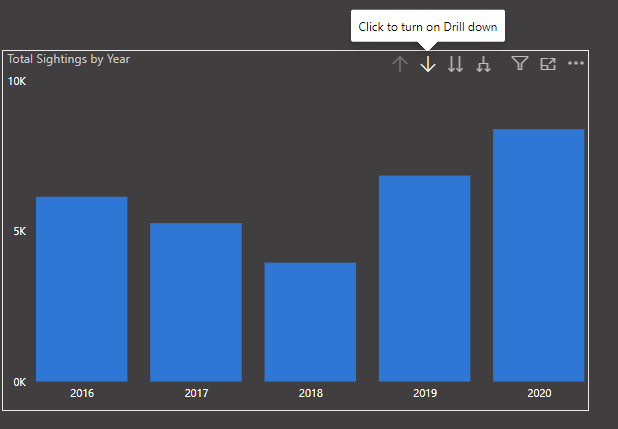
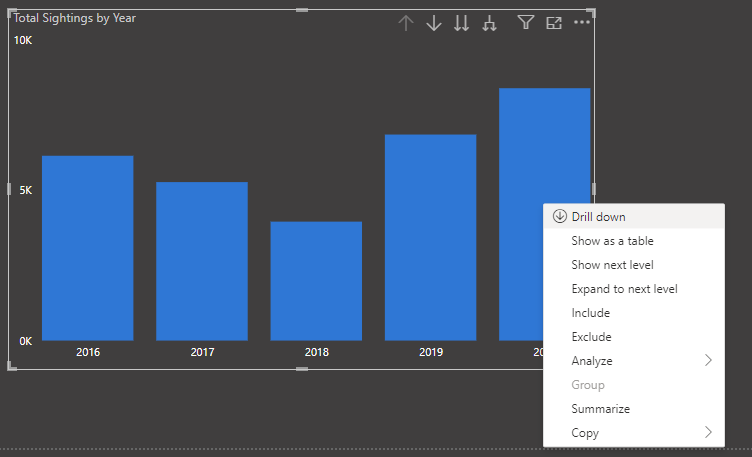
Turning drill down on by clicking the 2nd arrow (first image) and clicking on your datapoint OR by right-clicking a data point to open a menu with options (second Image). Use that menu or the 1st arrow to drill up.


You can use the arrows to complete this actions as well.
If you use the 3rd arrow, this would drill down by 'grouping' common rows (Think of this as a Group by in Alteryx or Tableau Prep)
The 4th arrow will Drill Down to the next field without 'Grouping'
If you have a table, you can also add +/- icons to drill (select visual -> visualisations -> row headers -> turn on +/- icons
Considerations and Limitations: By default, drilling doesn't filter other visuals in a report, but this behavior can be changed by the report designer.
The workaround that I have found was to drill to the level that you want (E.G. Turn on drill down, select the datapoint and drill down to the level that you want. Then turn off drill down and select the desired data point, this way the other visuals will also filter).
