One more day of Dashboard week!
For the fourth day of dashboard week, DS40 had to visualize historical results (between 2014-2023) from the London Marathon.
https://www.tcslondonmarathon.com/results/race-results?ref=thedataschool.co.uk
We particularly needed to search for runners based on the first two initials of our surname.
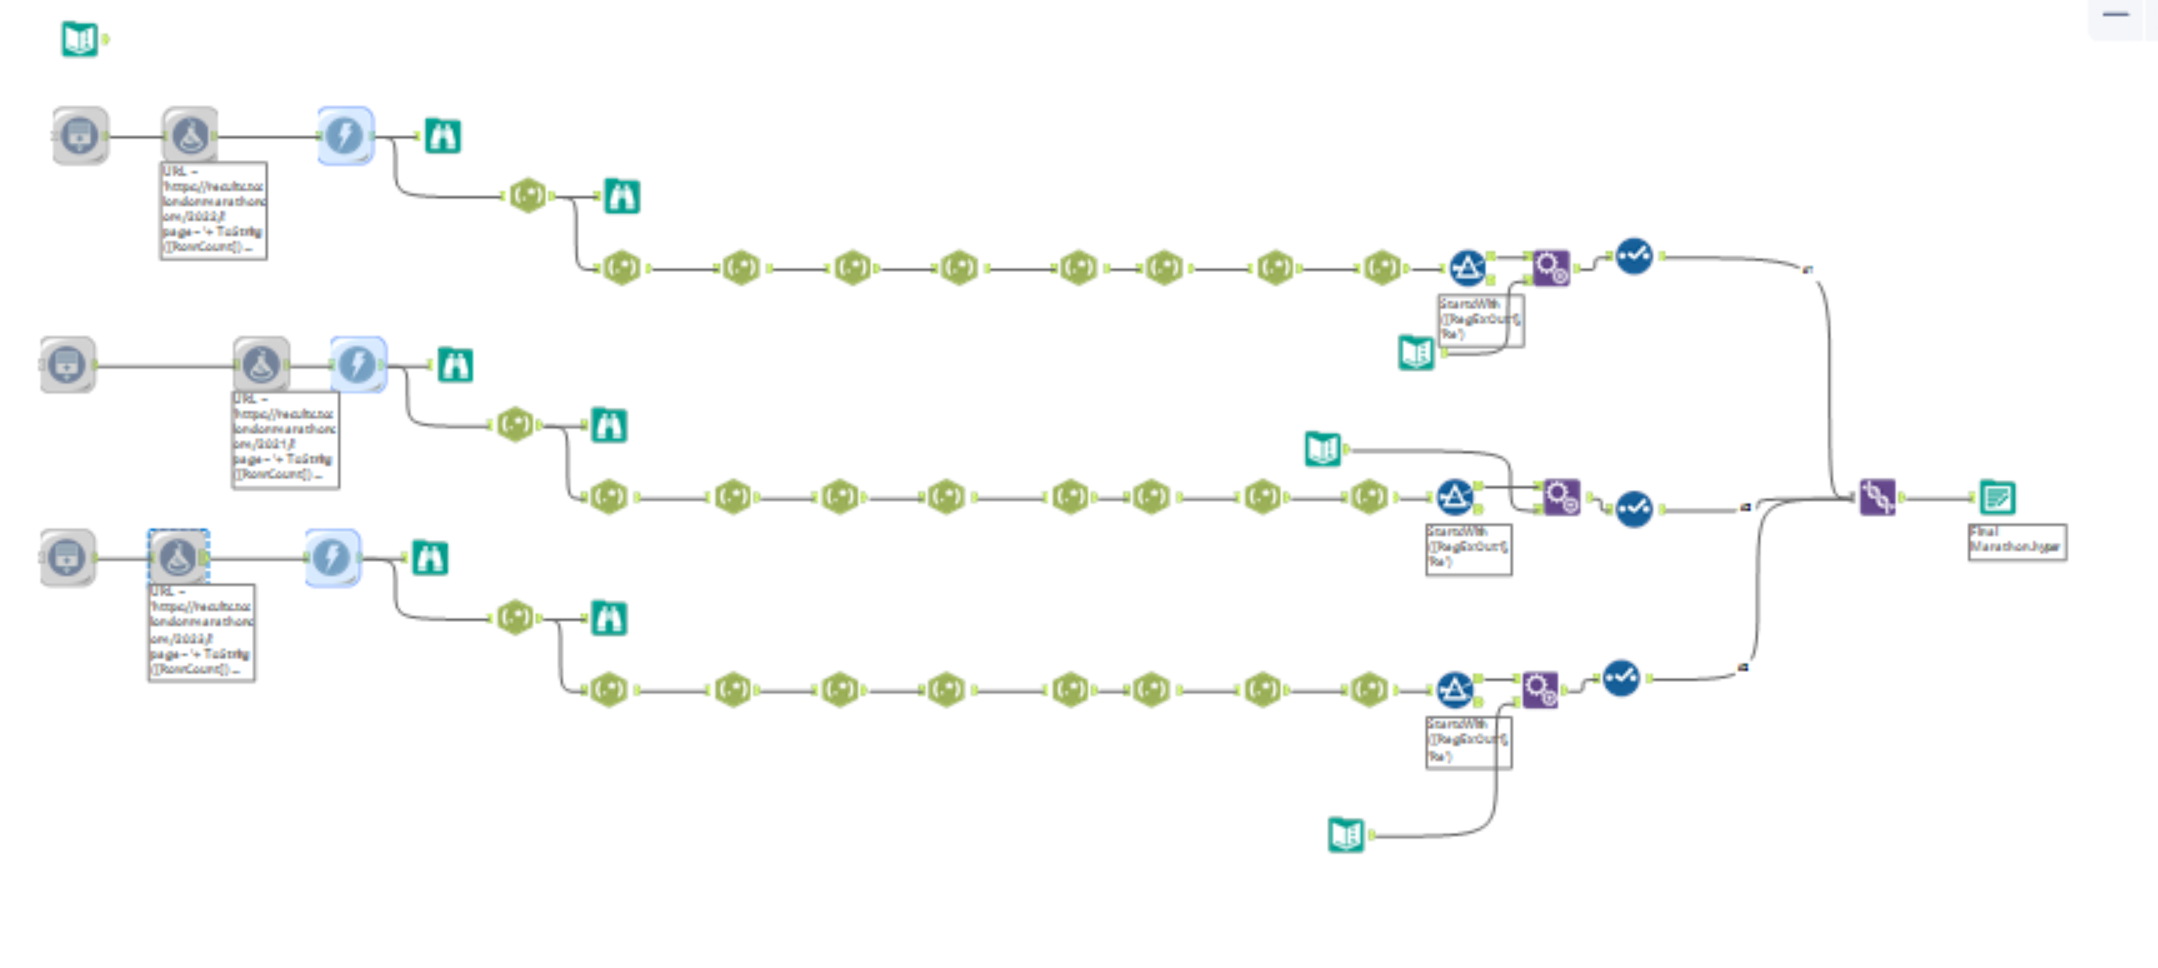
To get the data I needed to create the dashboard, I needed to use Alteryx and web scrape the website to take the relevant information. Alteryx gives us a range of tools to help make this process smooth. Through this software, we can get the full HTLM and then use a tool to take relevant information. I first created a flow for a single year and then repeated the process for more years. Unfortunately, I could not get more data rather than 2021-2023
The workflow:
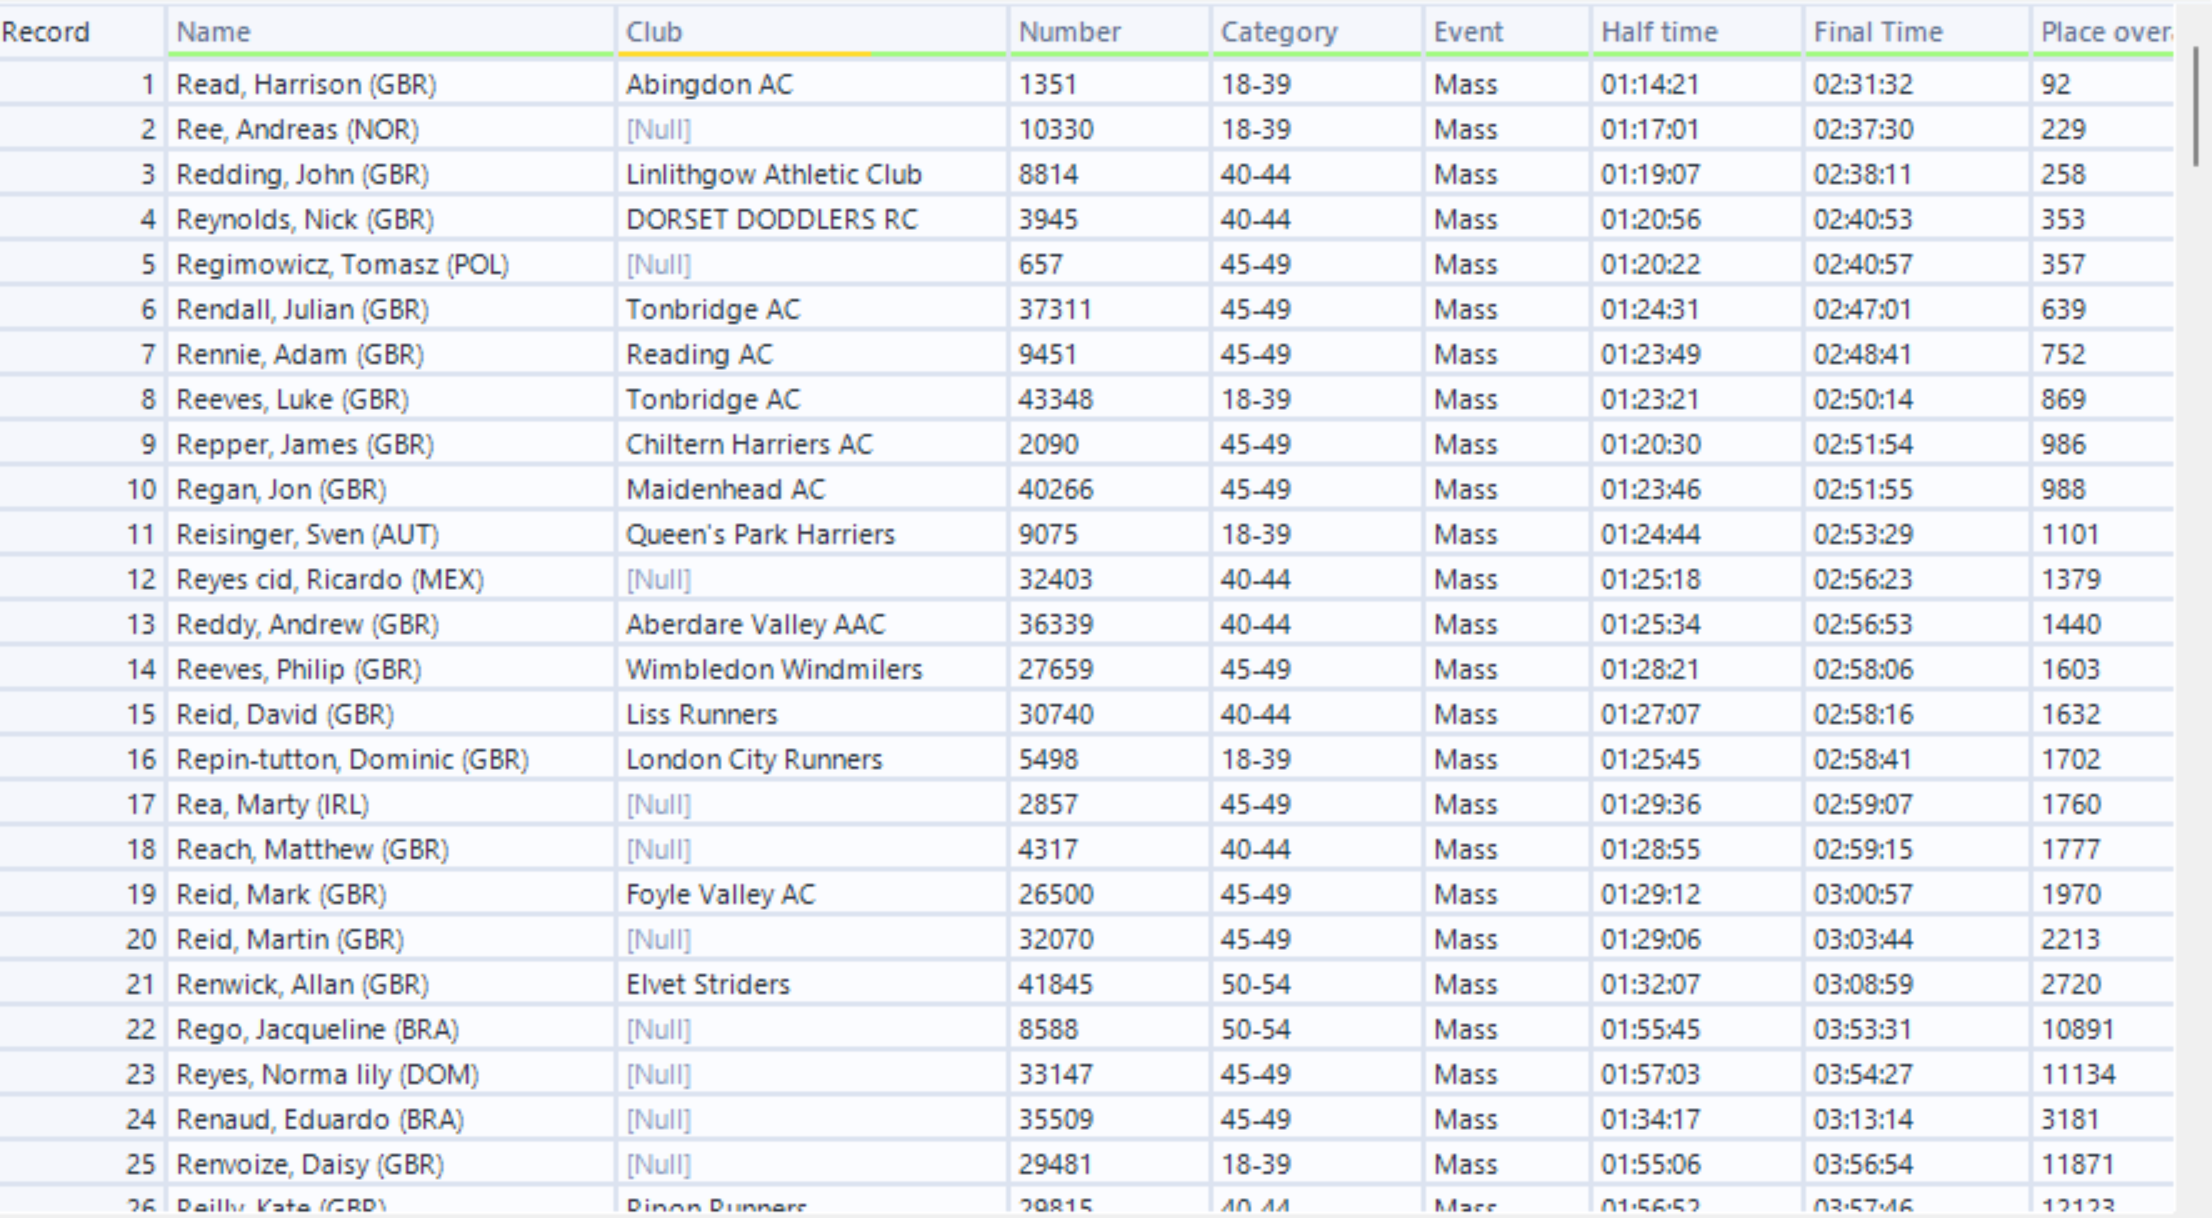
The Final Data
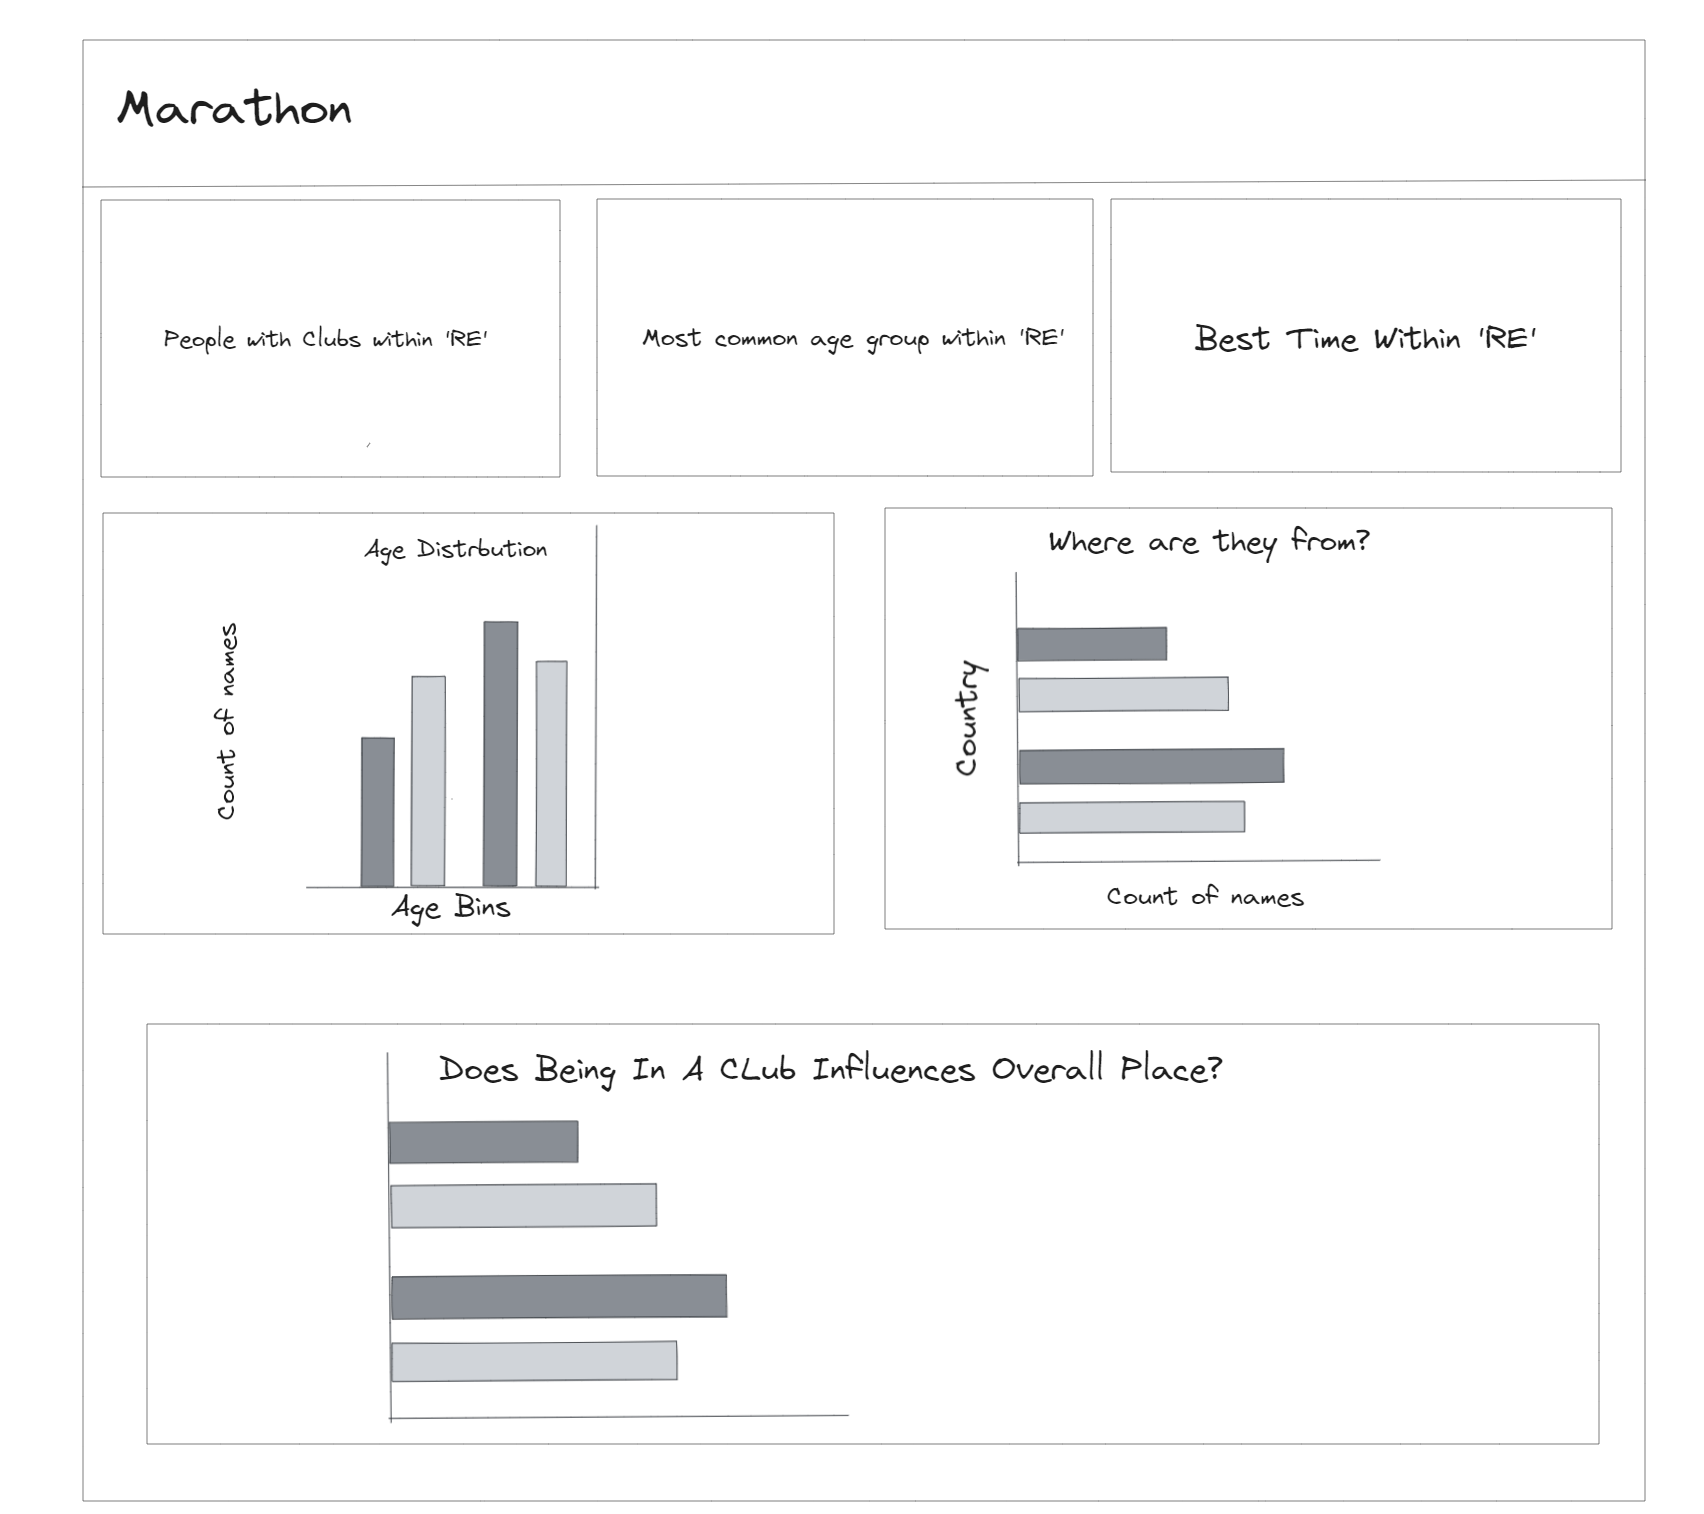
While waiting for the workflow to run, I also created my dashboard sketch
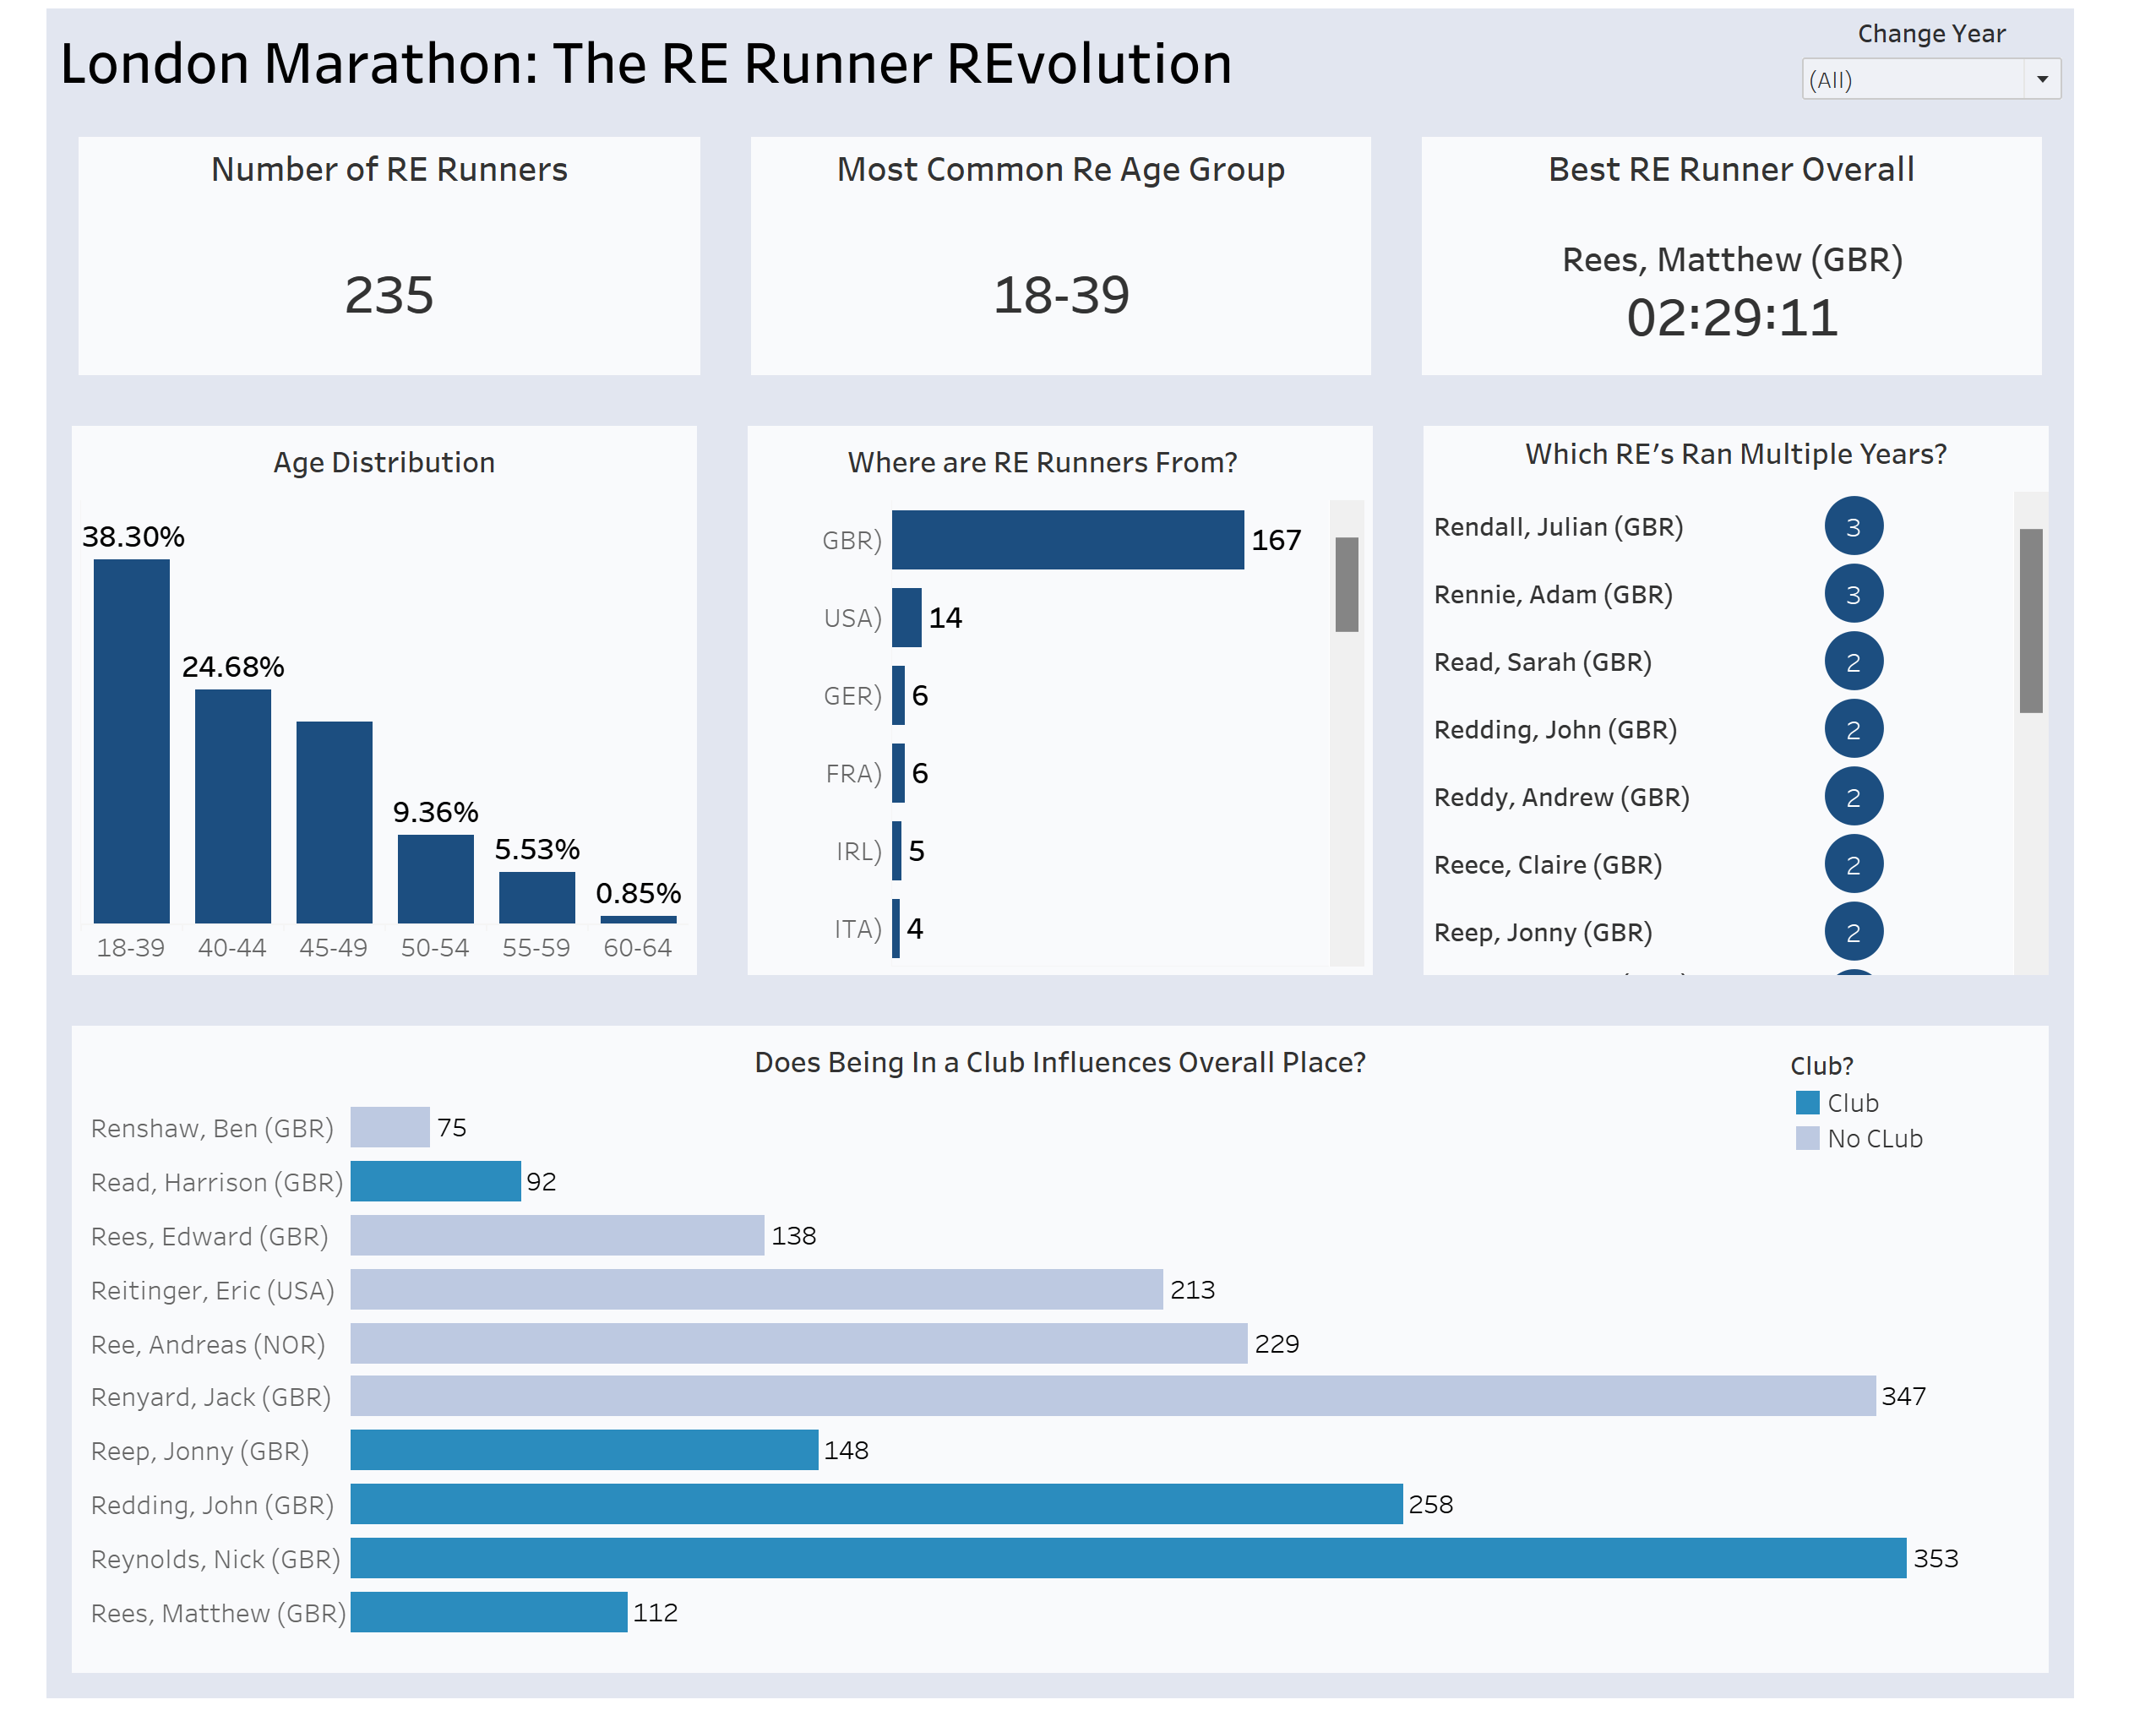
This was the final dashboard