


Something that I discovered in training and I feel like I've mentioned before, is that I think dot plots are often superior to bar charts. Potentially a controversial opinion but hear me out. Dot plots provide everything you want in a bar chart and more. Quite frequently, a bar chart is being used to show the average across a category with sub-category details completely omitted unless a secondary chart or drill down is used. That takes up extra space or asks the user to find the hidden details, both of which we try to minimise as consultants. So, how can you show both the distribution and a benchmark value for the overall group? Of course, with your trusty dot plot. I think they're excellent, but they do come with the exception that when some data points are more closely grouped together, the overlap makes them more difficult to distinguish. You can adjust the opacity of the dots to demonstrate density (where the dots which remain darker despite reduced opacity show more overlap) but this isn't a perfect solution. I wouldn't say there is a perfect solution to this issue actually, all charts come with flaws, but one other way to overcome the density problem is by using a jitter plot. The jitter plot spreads the dots in parallel to your category axis so that the value they represent is unchanged and the density issue is removed. A naive audience however might misinterpret the jitter to mean something so it is of key importance to highlight that only the value in your value axis direction holds meaning.
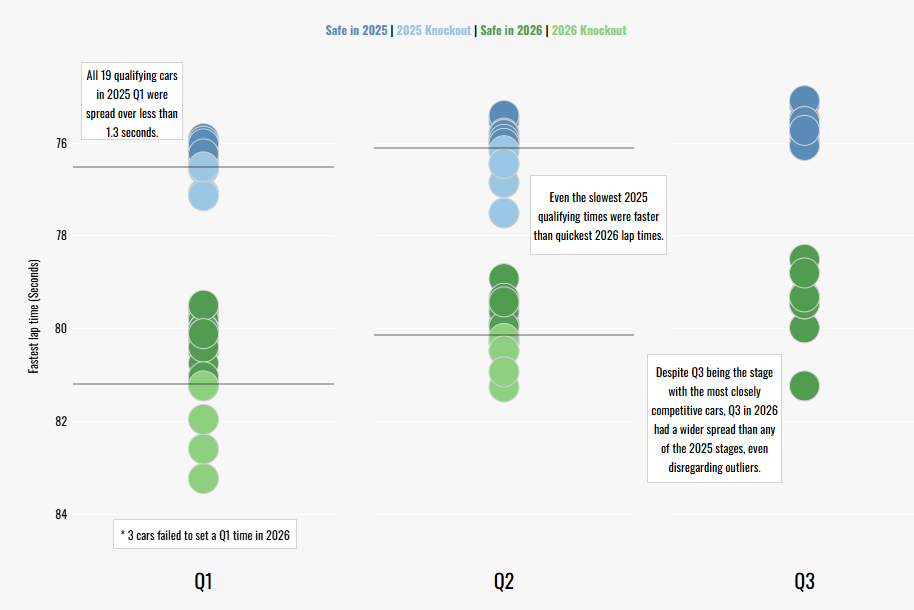
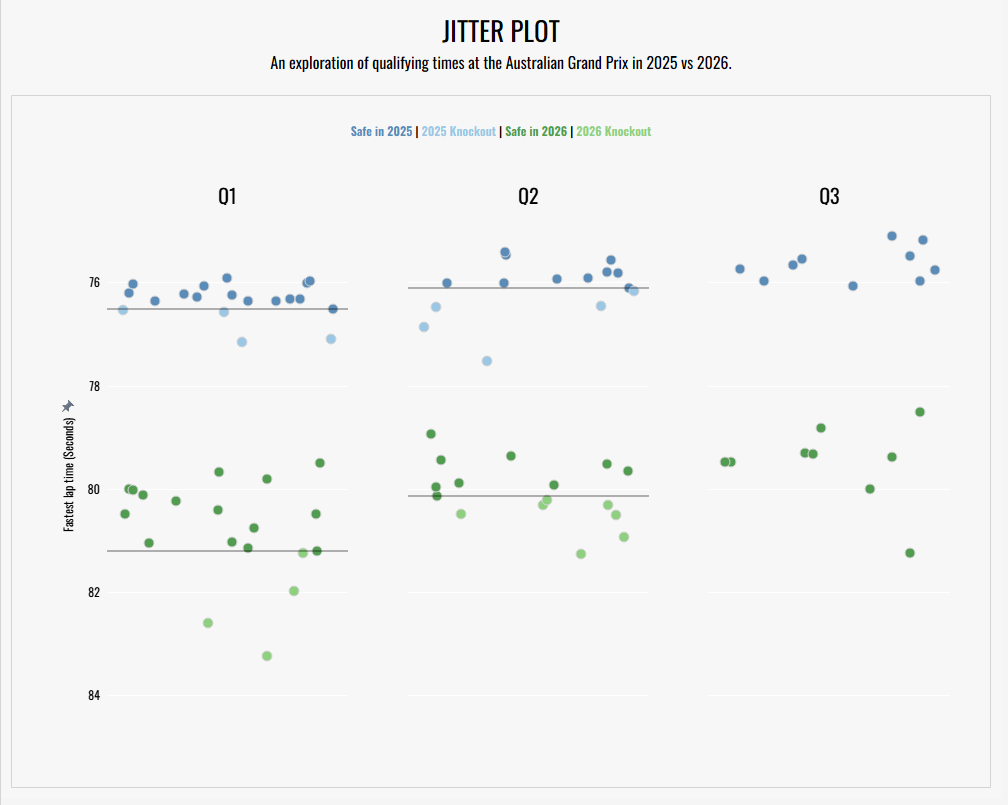
Today, the data I'll be using is a dataset I prepped myself on qualifying in Formula 1. To be perfectly honest, I'm not too bothered with the overlap that is seen in the dot plot I originally created (as you can see below and published on Tableau Public) because I think it demonstrates how closely the field is bunched together. But if I wanted to see the individual data points, then I'd need a jitter plot so that's what we're going to do. Let's jitterbug!
Step 1: Build your dot plot.
Before you learn how to jitter, you have to learn the fundamental steps. To create a dot plot, it's really rather simple and very similar to creating a bar chart really.
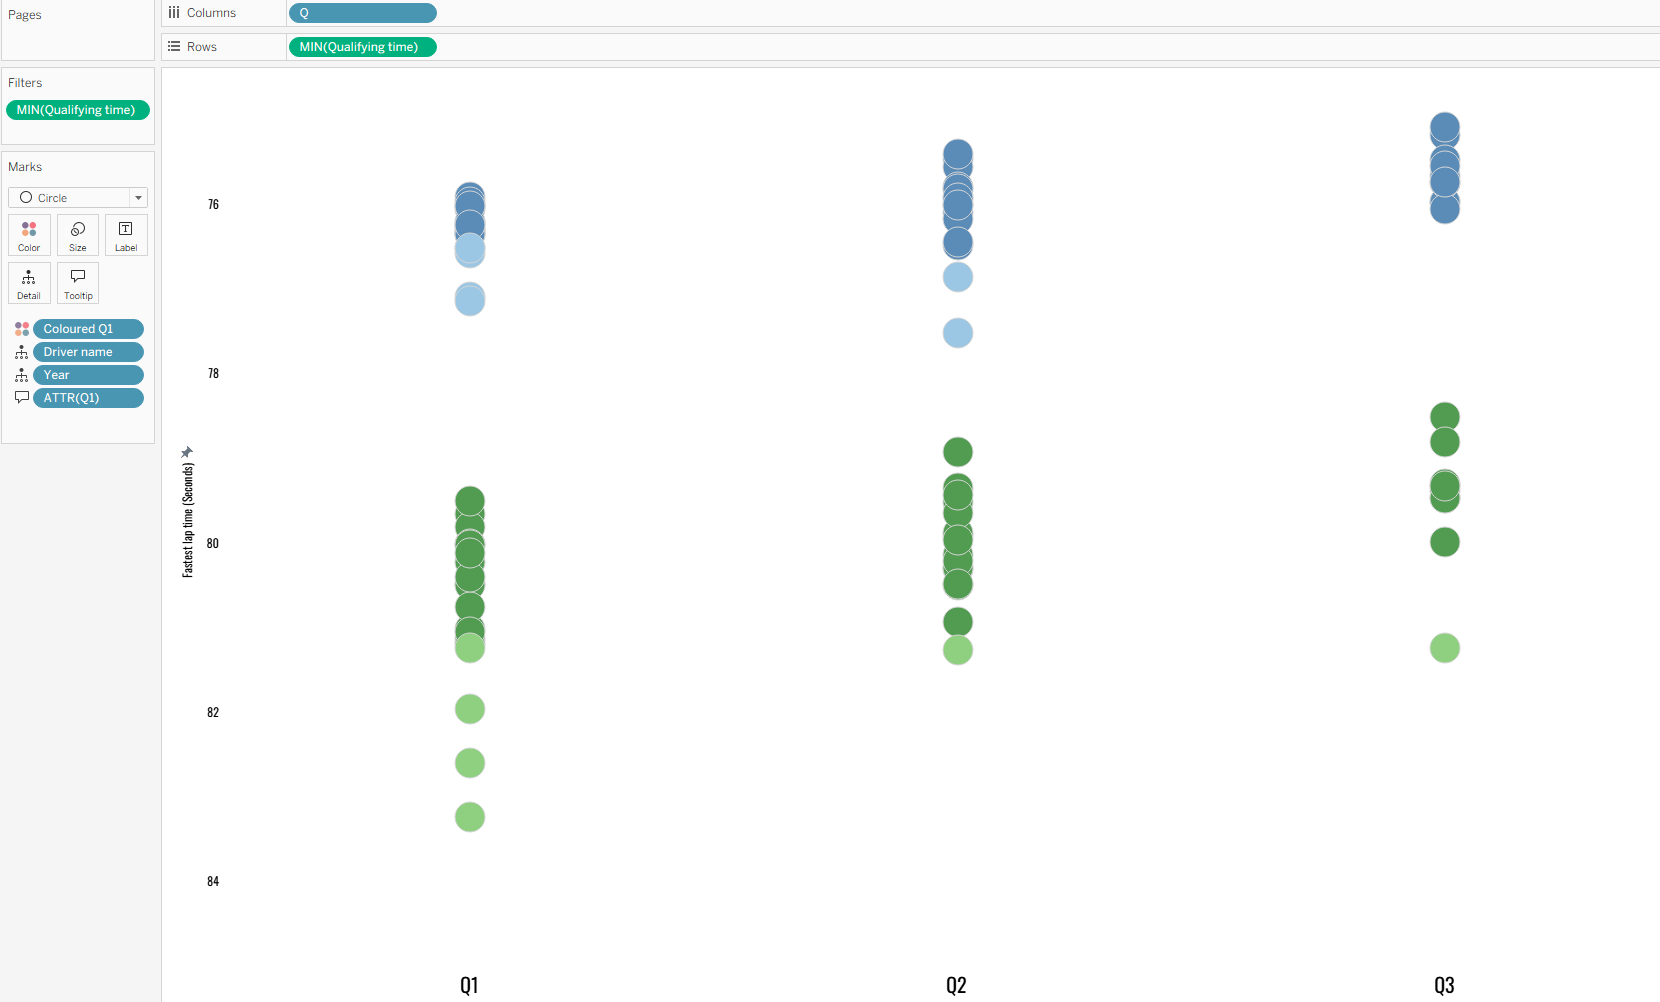
- Depending on the orientation of your dot plot (I'm using a vertical dot plot in this instance), drag your over-arching category to rows/columns. For me, that's dragging my Q field to the columns shelf.
- Then add your measure to rows (for me, that's qualifying time). Make sure that your measure is correctly aggregated. It depends on how your data is set up and how you want to show it. I've only got one value per sub-category and category (i.e. the fastest time for each driver in each qualifying stage) so the aggregation won't have as much of an effect. I like to choose MIN() though to be on the safe side.
- Add your sub-category to detail on the marks card (for me, this is driver). The sub-category will be what each dot represents.
- Lastly, add your category field to colour (I've created a calculated field to show when a driver is knocked out too).
Step 2: Jitter.
Once you've created your dot plot, the hardest part is over. All you need to do now is create a calculated field to jitter the dots. This uses the random function which assigns each row a random value between 0 and 1.
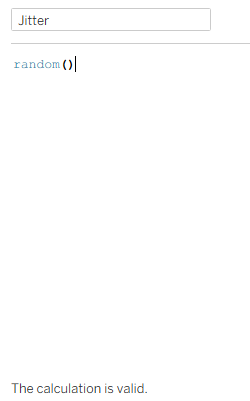
Don't worry if the function doesn't automatically pop up like many of the other functions in Tableau Desktop. Just keep typing and make sure that the calculation shows as valid at the end. This is a weird quirk and I have just googled why this is the case. Apparently, Tableau doesn't support the function and therefore it isn't officially documented because it doesn't work on all data sources. I've never had it not work the times I've used it though so I'd recommend still giving it a try! Also, I have no other solutions on how to jitter otherwise but if it doesn't work then at least you have a lovely dot plot.
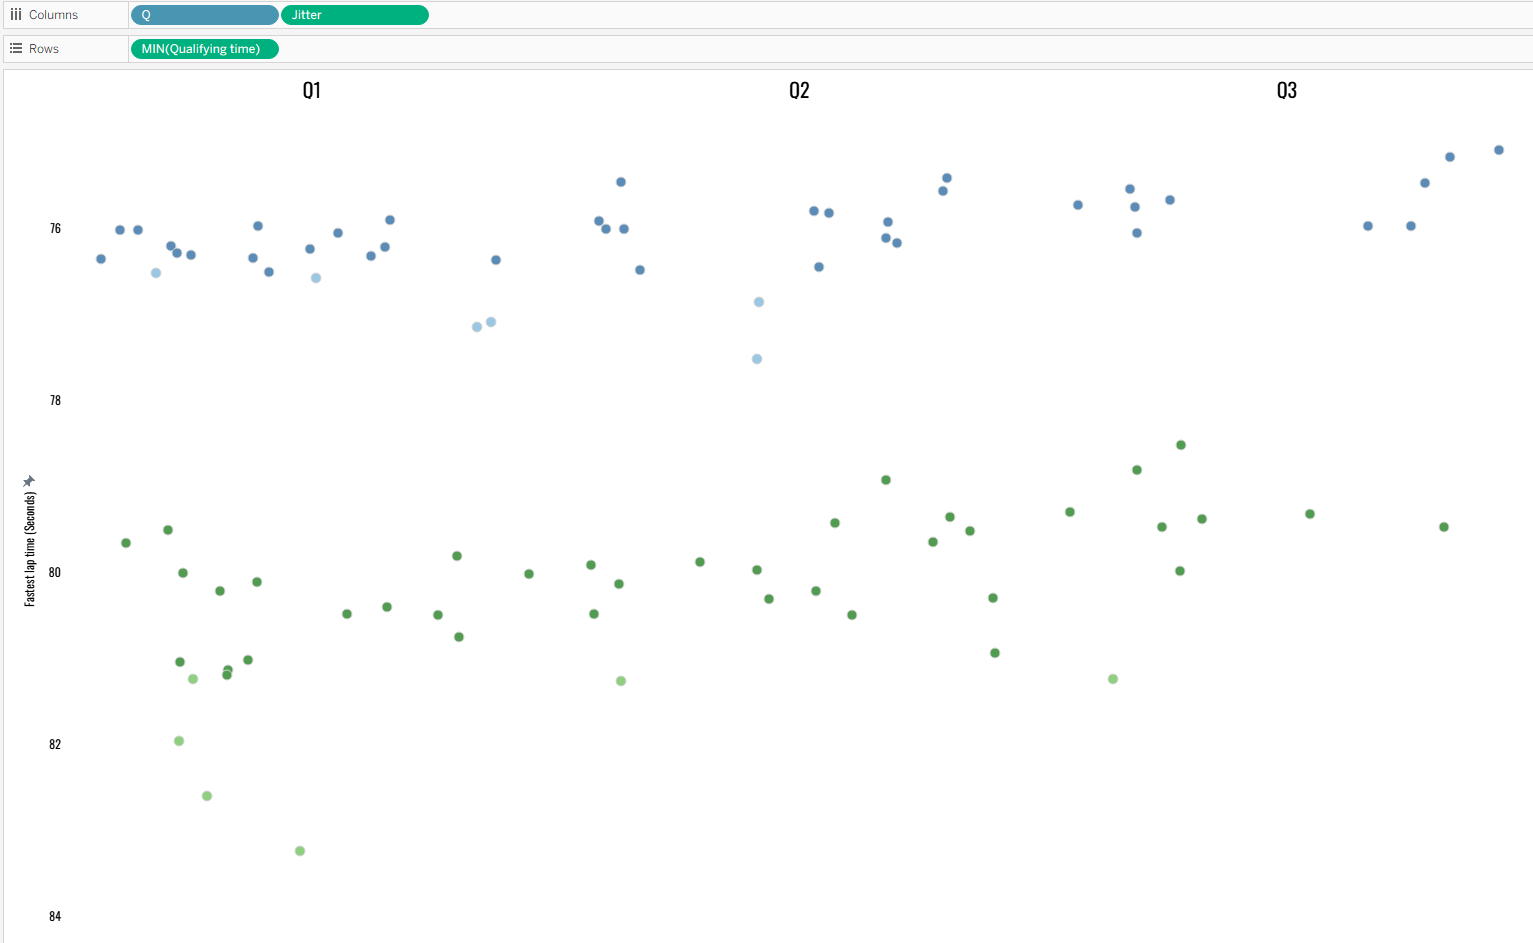
Add your jitter calculations onto the same shelf as your category. For me, that's the columns shelf. Ensure that your jitter field is set to a continuous dimension and you should have a functioning jitter plot!
Step 3: Make it pretty!
AKA format your jitter plot and/or dashboard. Remove the jitter header. Add reference lines (disclaimer: I actually created three separate jitters to get my reference lines as they are below because of how I formatted my data). Make the colours pretty. Sort out your tooltips. Do what you'd like to do to make your jitter the best it can be.
And that's how to create a jitter plot. Quite a simple chart that looks like it's taken more time and effort than it really has. Until next time, happy jittering!
P.S. I really hope that you're hearing the jitterbug song that I'm thinking of when you read this blog. I've just looked it up, it's by Wham! and actually called Wake Me Up Before You Go-Go. I'd recommend giving it a listen so it can be all you'll think of whenever you create a jitter plot in the future.