


I wrote this post while listening to this song. 🎧 Hit the play button and enjoy!
Today’s challenge comes from our Coach Robbin. He’s a huge Rick and Morty fan. So all we had to do is connect to the Rick and Morty API and get the data to start building - having fun - a dashboard about these quirky characters.
First I read the API's documentation. To be fair it was pretty straightforward. Then I open the Alteryx Designer and started building my workflow.
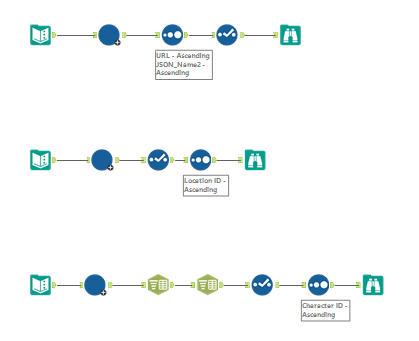
We have three tables in this dataset: Episodes, Characters and Location. So I decided to use a separated flow for each.
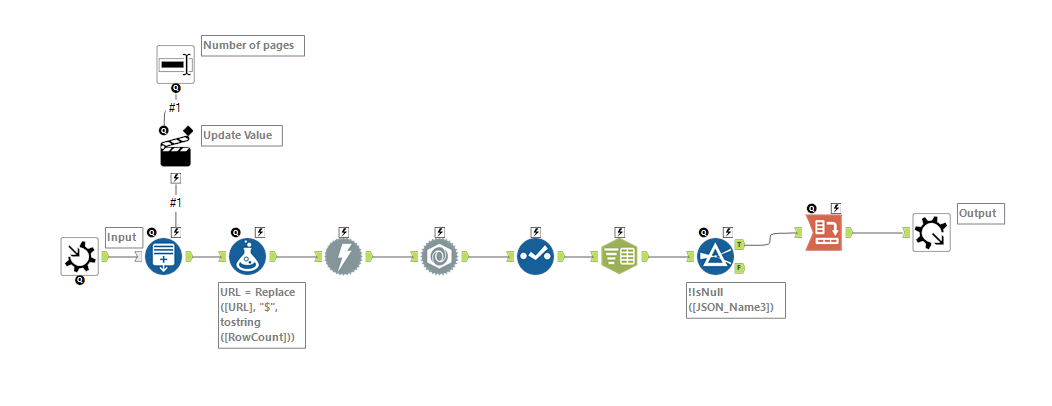
For this API I had to use pagination as the API has a limit of 20 series. For this task I decided to use a Standard Macro, so all I needed to do was change the number of pages for each table. You can see the macro below:
All right, after have all the data I started researching references. Once again I used dibbble, google images, pinterest and Tableau Public. I found some cool viz in tableau public, most of them made by DSers form old cohort - including coach Robbin.
This time I didn't make any sketches. I just opened tableau and started build some charts.
I must say that Tara helped me a lot in this dashboard. She showed me how to make a honey comb chart and how to open an image when you click each character. THANK YOU Tara 😊. Check her blog to see how was her process of today's task. Her Rick and Morty dashboard is amazing!!
I still need to changes some colours of the portal, but I pretty happy with the result. You can see the full dashboard here.
I really enjoyed to make this visualization as Rick and Morty is one of my favorite TV shows. Also it was great to practice hwo to connect to the API's.
- For more tips follow me on LinkedIn and Twitter.
- You can check out my portfolio on Tableau Public.