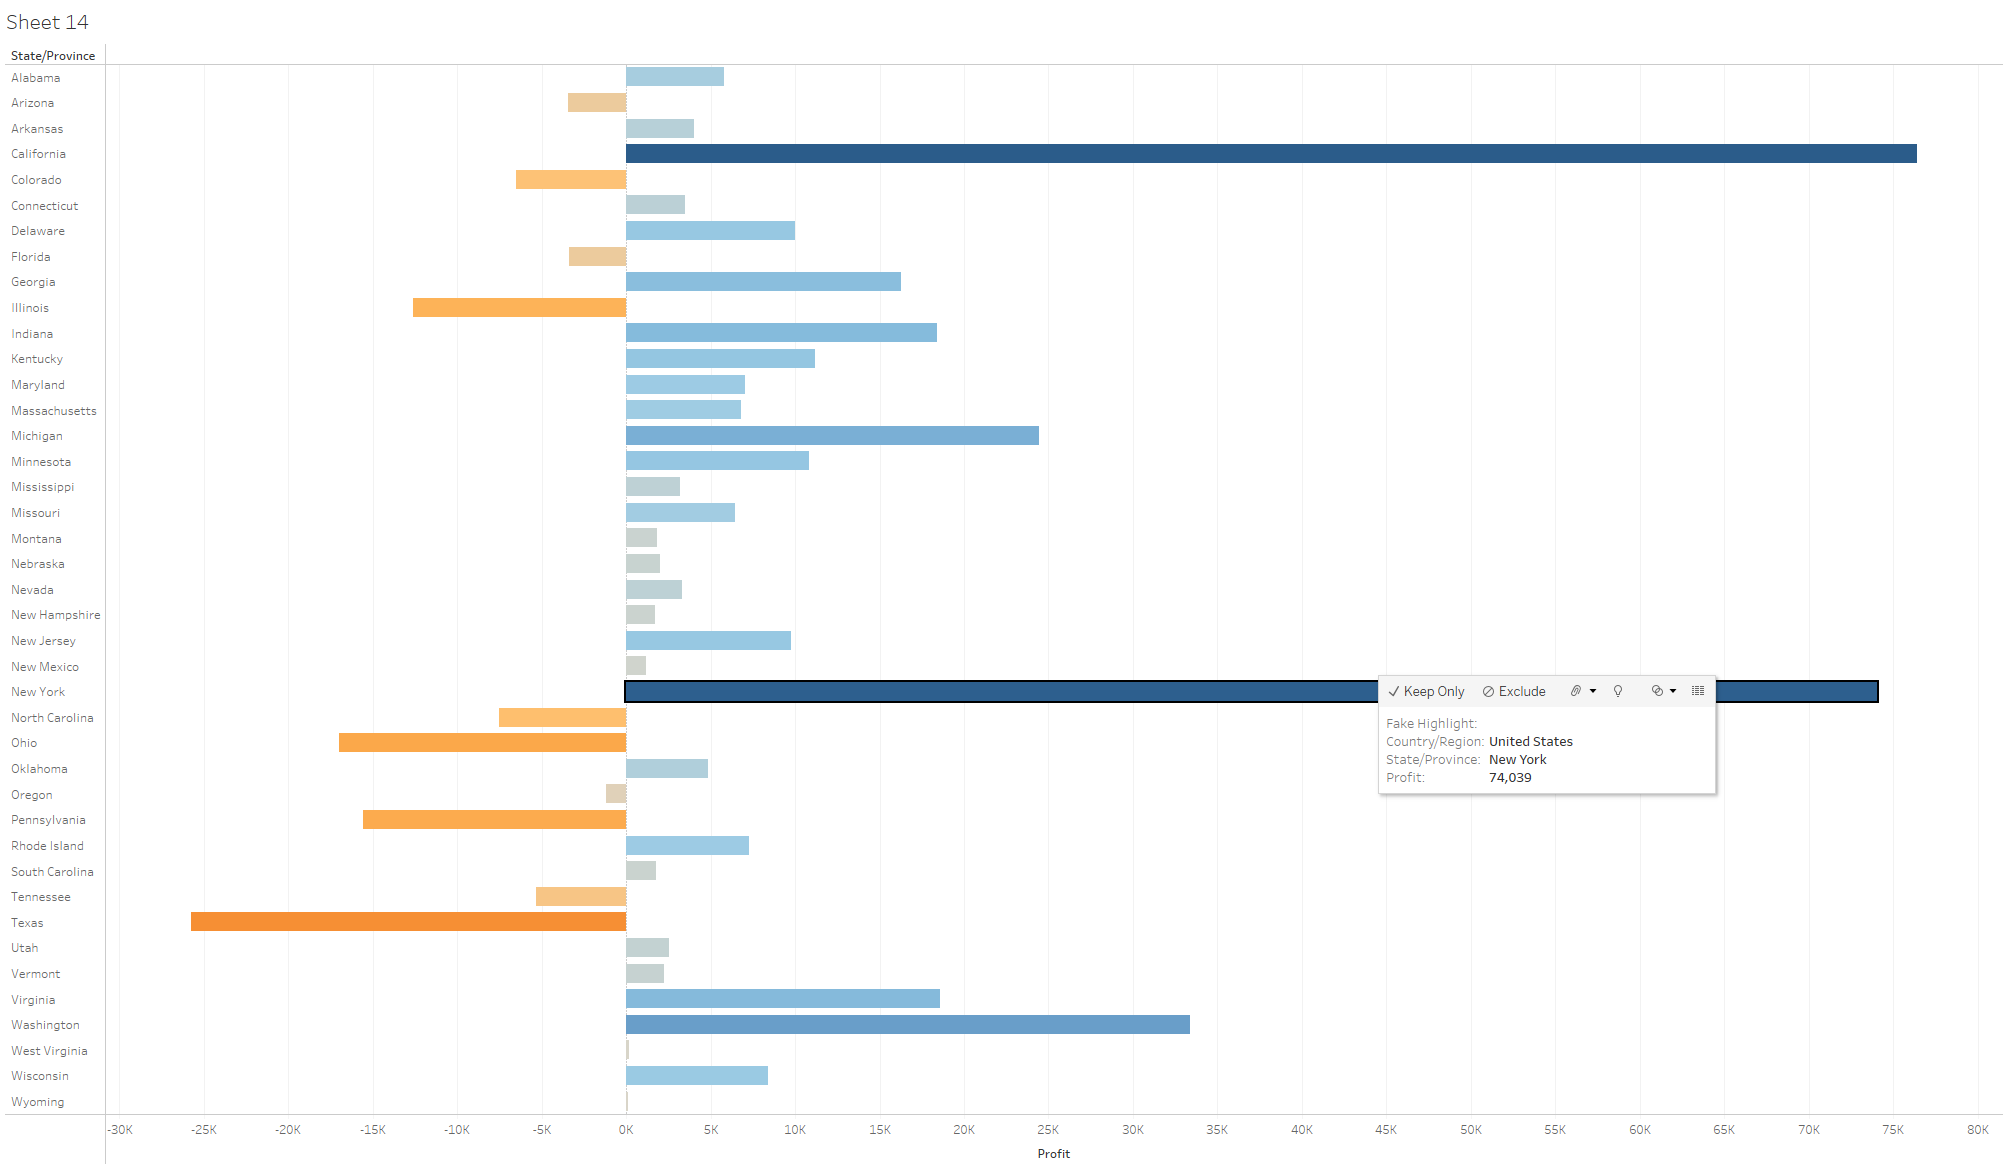
Tableau has the built-in feature that when you select a data point in a graph it becomes highlighted and other data points are blurred out (see example). However, there is a way to avoid this highlight by adding a fake highlight.
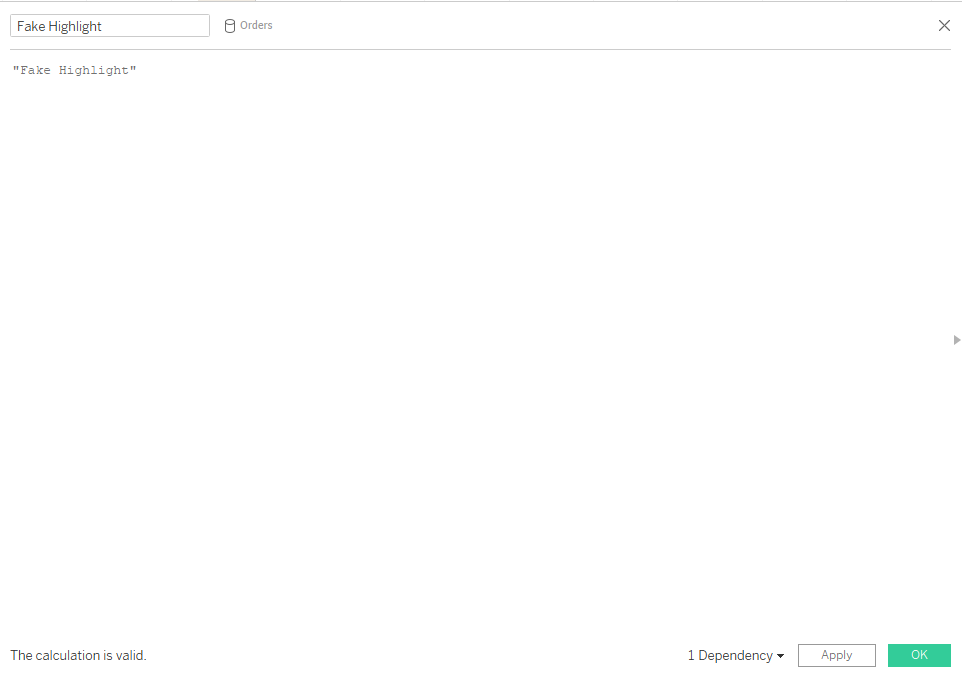
To add a fake highlight, you need to create a calculated field with a string. Note: It is irrelevant what is written in the string.
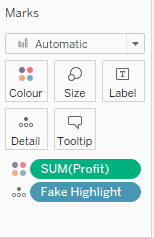
Afterwards you drag the newly calculated field onto detail.
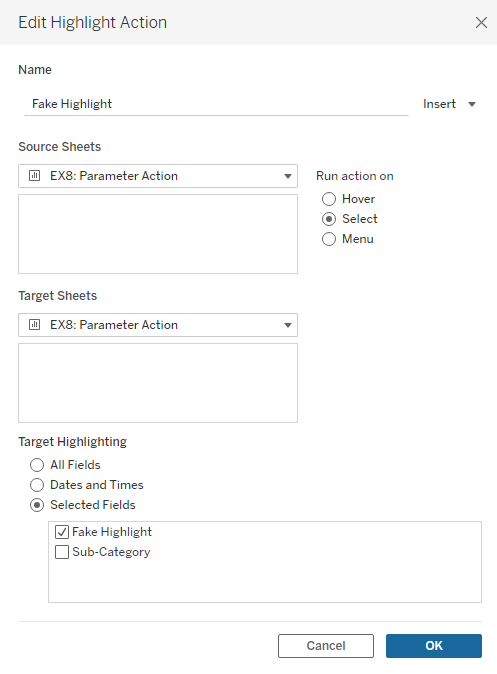
Lastly you click on Worksheet → Action (Ctrl+Shift+A) → Add Action → Highlight and select the following settings before clicking on OK. Note: If you use the worksheet in a dashboard you need to follow the same steps even if you have activated the action in the worksheet: Worksheet → Action (Ctrl+Shift+A) → Add Action → Highlight and select the following settings before clicking on OK.
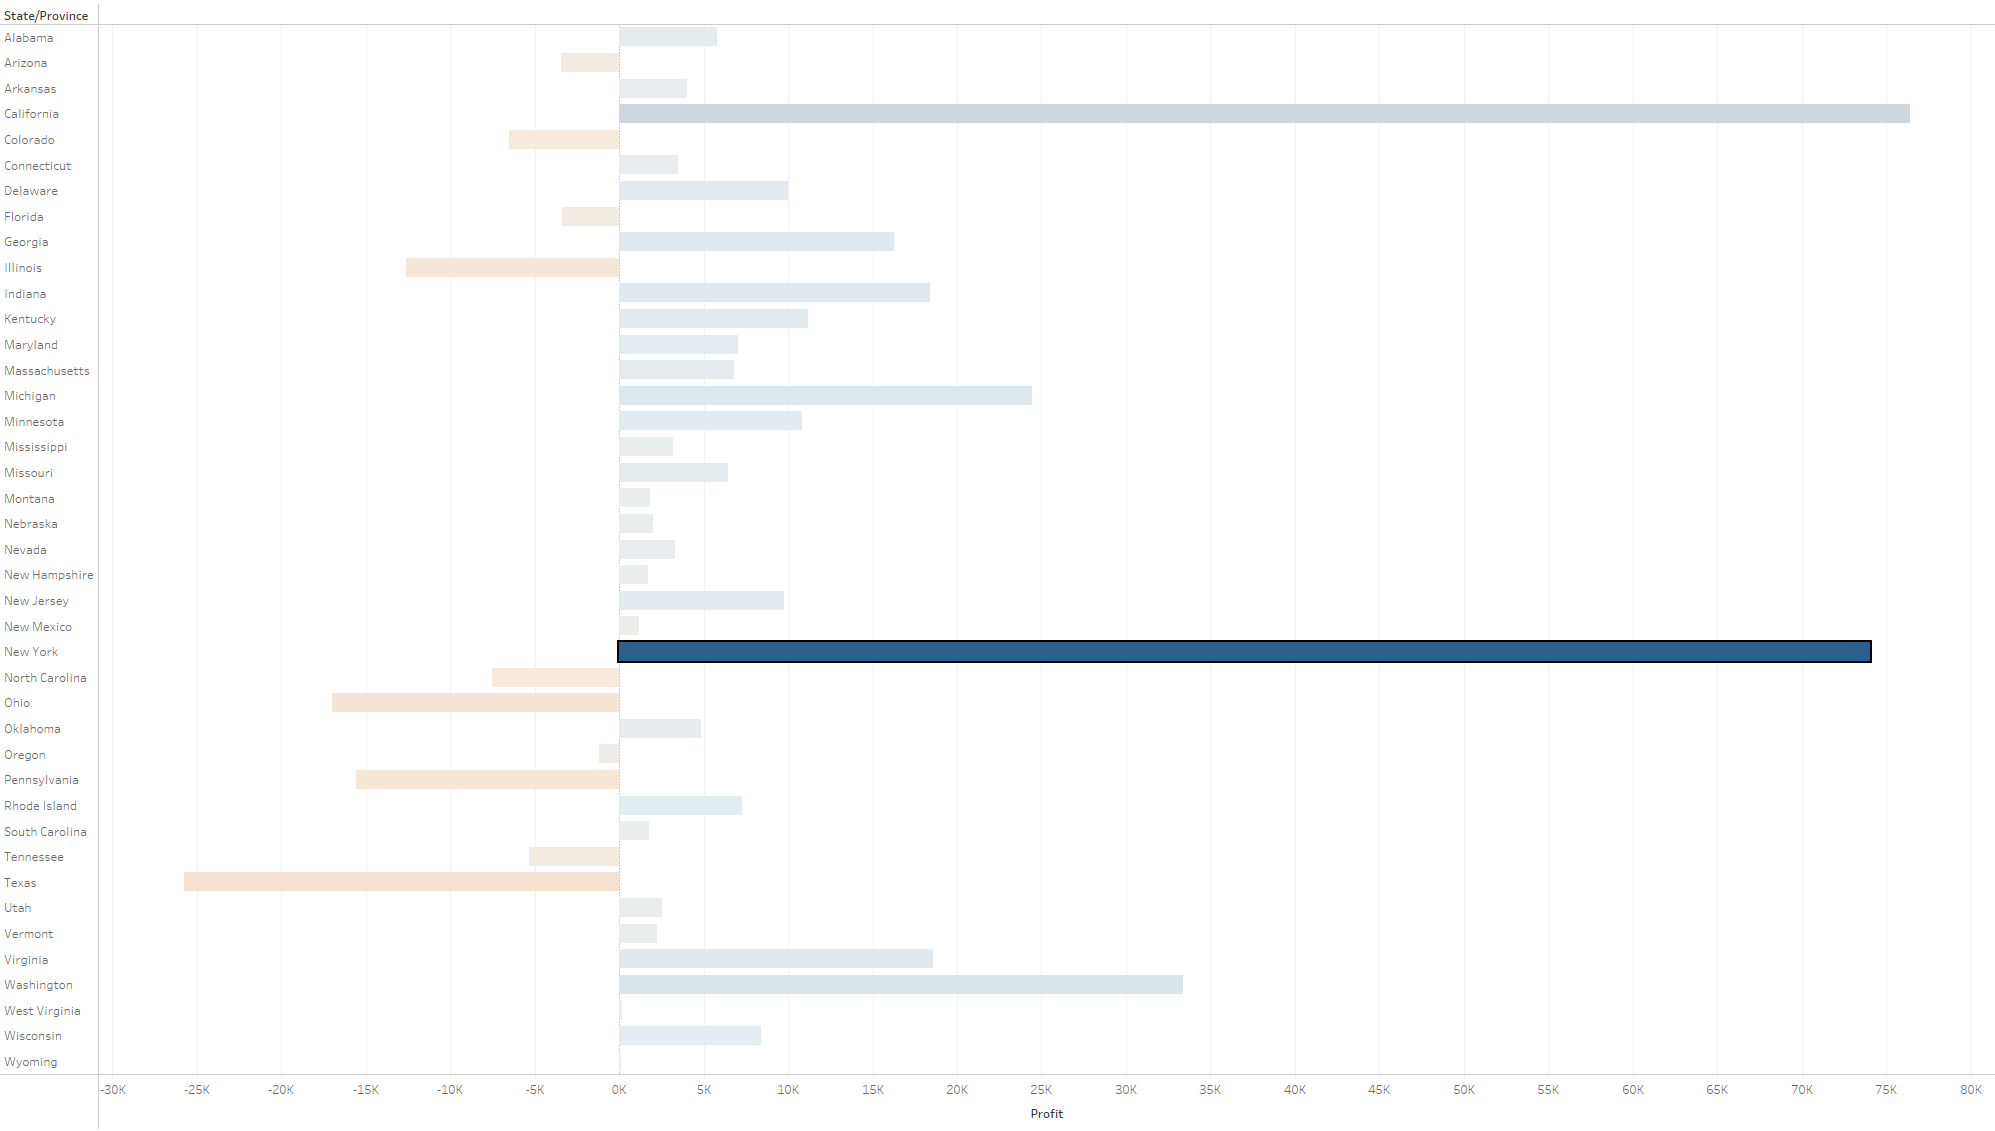
Now, even though you have selected a data point, there is no highlight to be seen.