


On day three of the dashboard week, I got weather data from an API with Alteryx. These data included different measures from selected cities. I compared European capitals to see which one is the best in each measure.
Data Preparation
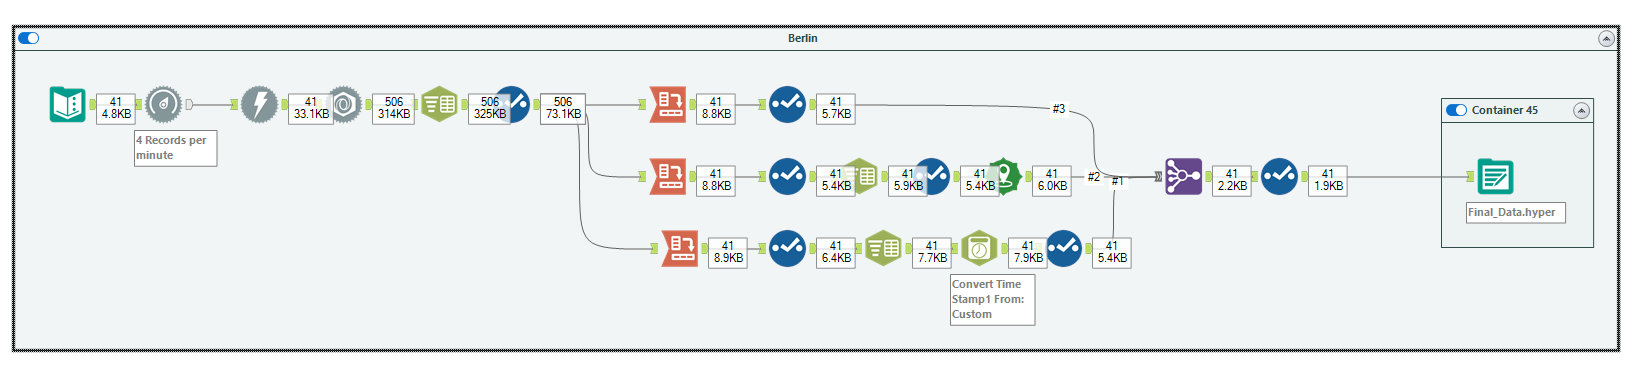
I started with a text input tool in Alteryx, in which I entered the URL of the API including the city, state, and country. Afterwards, I added a throttle to control for time limits on the API. Next in line, I used a download tool, and a JSON parse tool, before using the text-to-columns tool to navigate through the data a little better. With the help of three different cross-tab tools and a join, I managed to get all the necessary data for an individual city. However, the difficult part was doing multiple cities at the same time since each city needed a new URL and it was not always clear which state a city was in.
Sketch
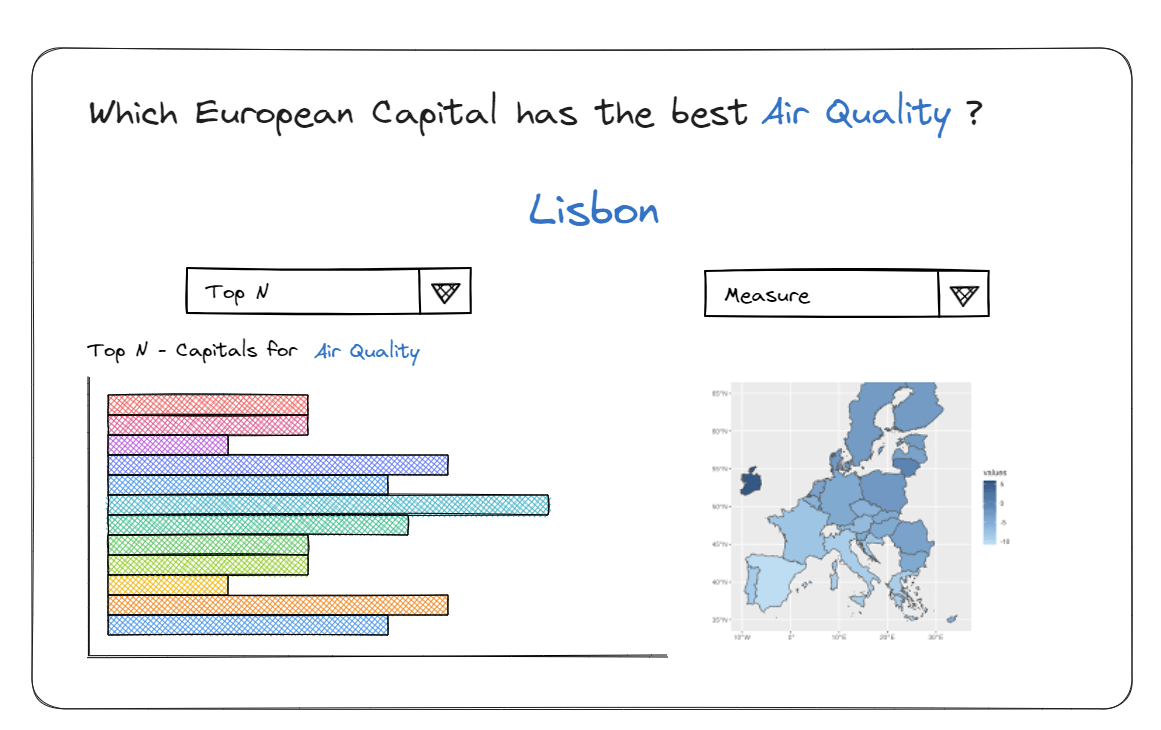
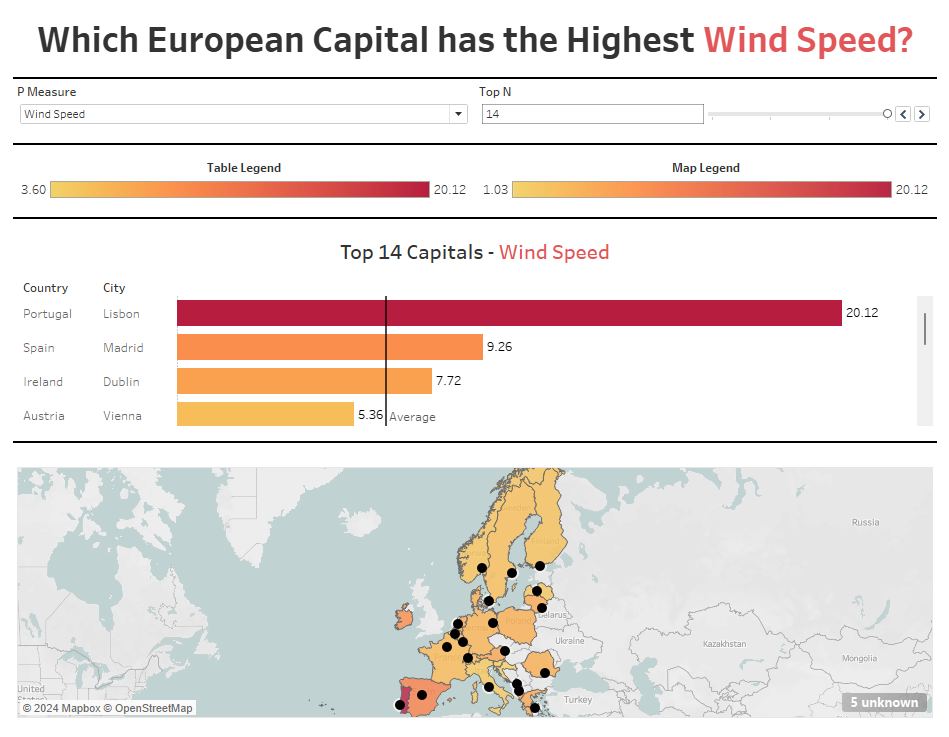
Dashboard
Positives
Since I only had one session of working with APIs, I was happy to take less than half an hour to have a look at an example city. This way, however, I got overly confident and thought I could get data for a large number of cities. In the process of collecting the data, I run into several issues. Here, I am proud to have a good mindset and was keen on solving the problems, even if it was not always successful due to time concerns. In the end, I also created a relatively good dashboard, especially considering the amount of time I spent on it.
Negatives
I massively overscoped my project, which led to poor time management. I ended up spending too much time on data preparation and too little on building the dashboard (>1 hour). Hence, I had not given enough thought to the dashboard layout and was not able to compute a LOD I had planned to use. Furthermore, I mixed up best and worst air quality thinking, the higher the value the better. Silly, mistake but with some high-quality fresh air and some extra time in the future it is definitely a project I would love to continue working on.