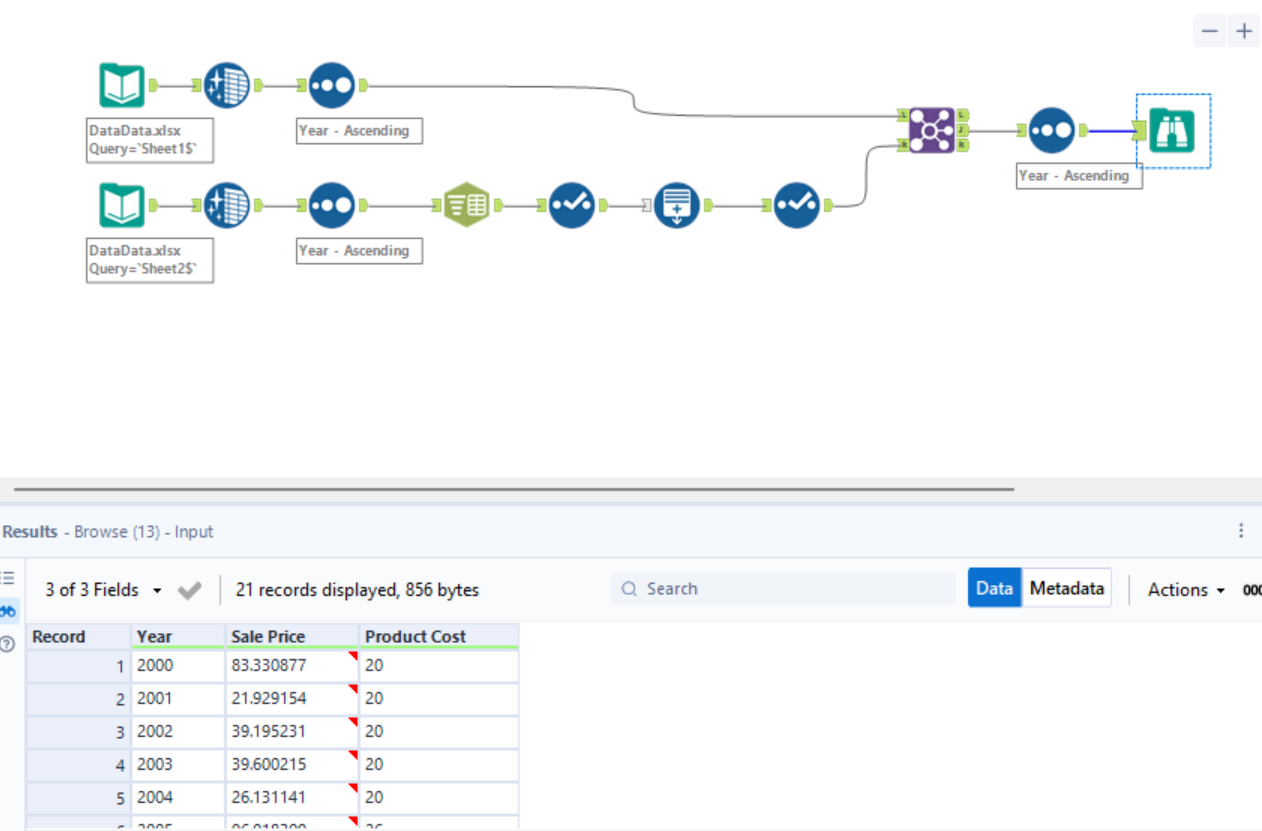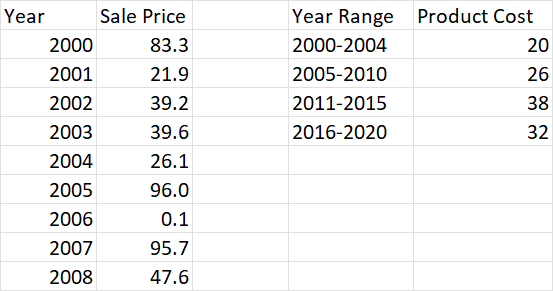
Alteryx lacks a dedicated "Join by Range" function, but it can still be achieved using multiple tools. Here I will walk through the process of joining the above two tables.
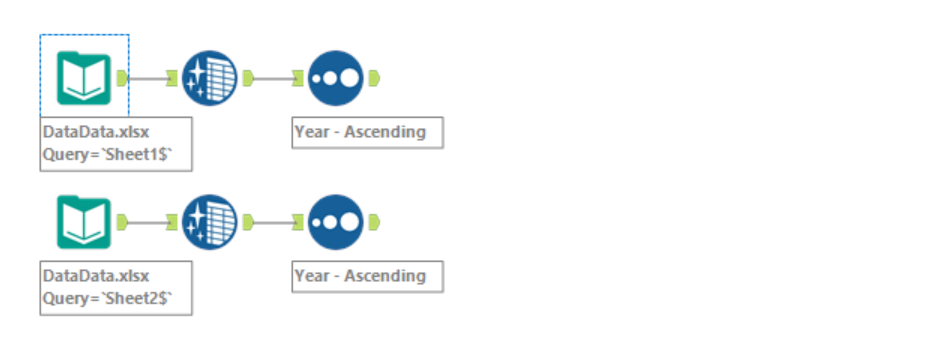
First I import both tables and use cleaning and sorting tools for basic preparation. The next steps are only performed on the "Year Range" table.
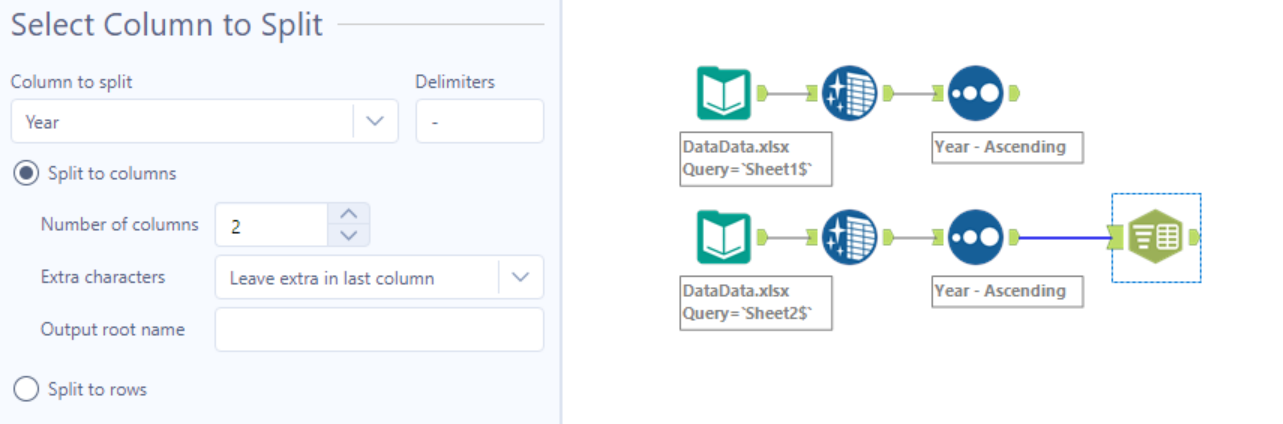
I use the "Text to Columns" tool to split the "Year Range" column using "-" as the delimiter. After renaming the new columns, this table is generated:
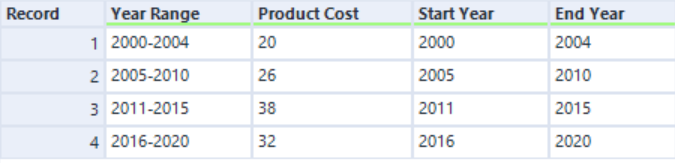
I now use the "Generate Rows" tool to generate a new row for each individual year - as well as a new column labelled "Year" to identify them. This table can now be successfully joined with the first table.
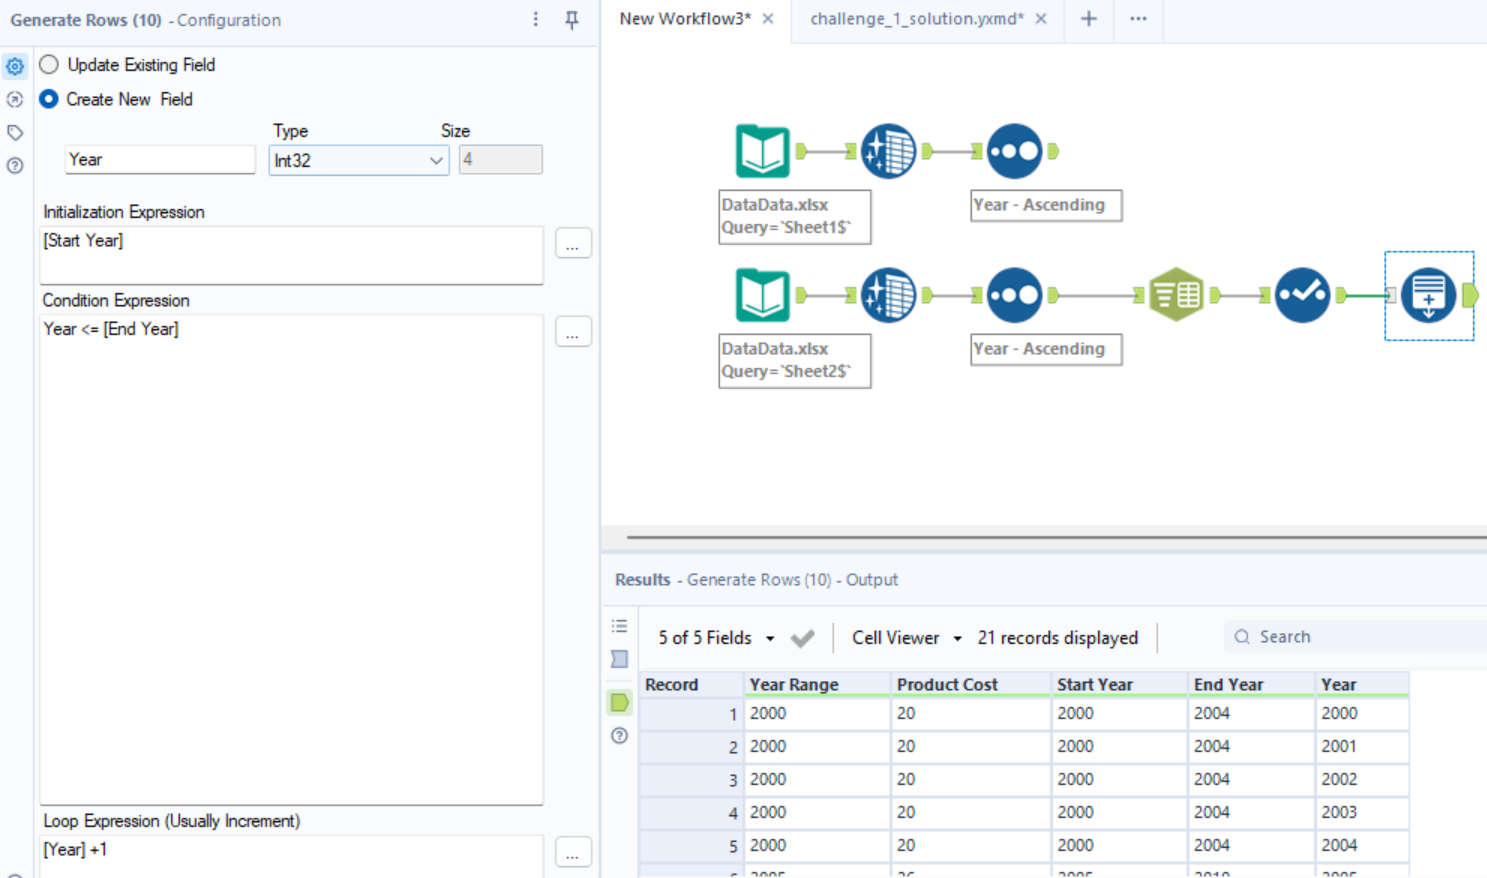
The "Initialization Expression" determines the value for the first row to be generated. The "Condition Expression" must return a Boolean: when it is true the "Loop Expression" is carried out, which generates the new rows. We can now join the two tables: