


Current and Previous Year metrics such as 'Latest Year Sales' and '% Change from Previous Year' are useful for giving quick contextual numbers to a reader. They're often included in the KPIs sections of dashboards. You could also include them in a single chart, as shown below:

Below are the steps to accomplish that (using Tableau's Sample Superstore data if you want to follow along).
#1. Create calculations to identify latest and previous years. There are two ways to do this: using regular calculated fields or FIXED LODs. For our example, we'll use FIXED LODs to get begin getting some practice in as we'll need to use them later.
i) Create a Calculated field for the latest year:
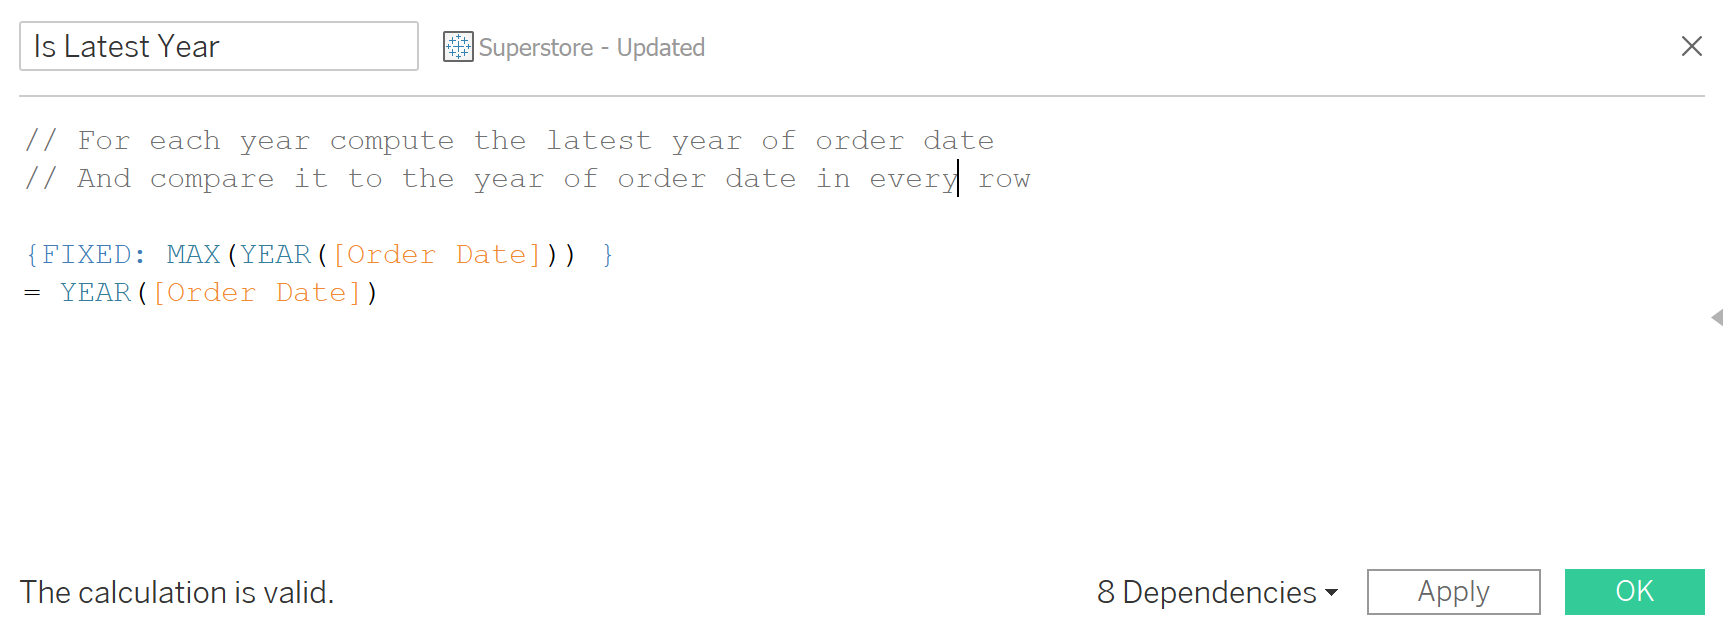
{FIXED: MAX(YEAR([Order Date])) }ii) And a calculated field for the previous year:
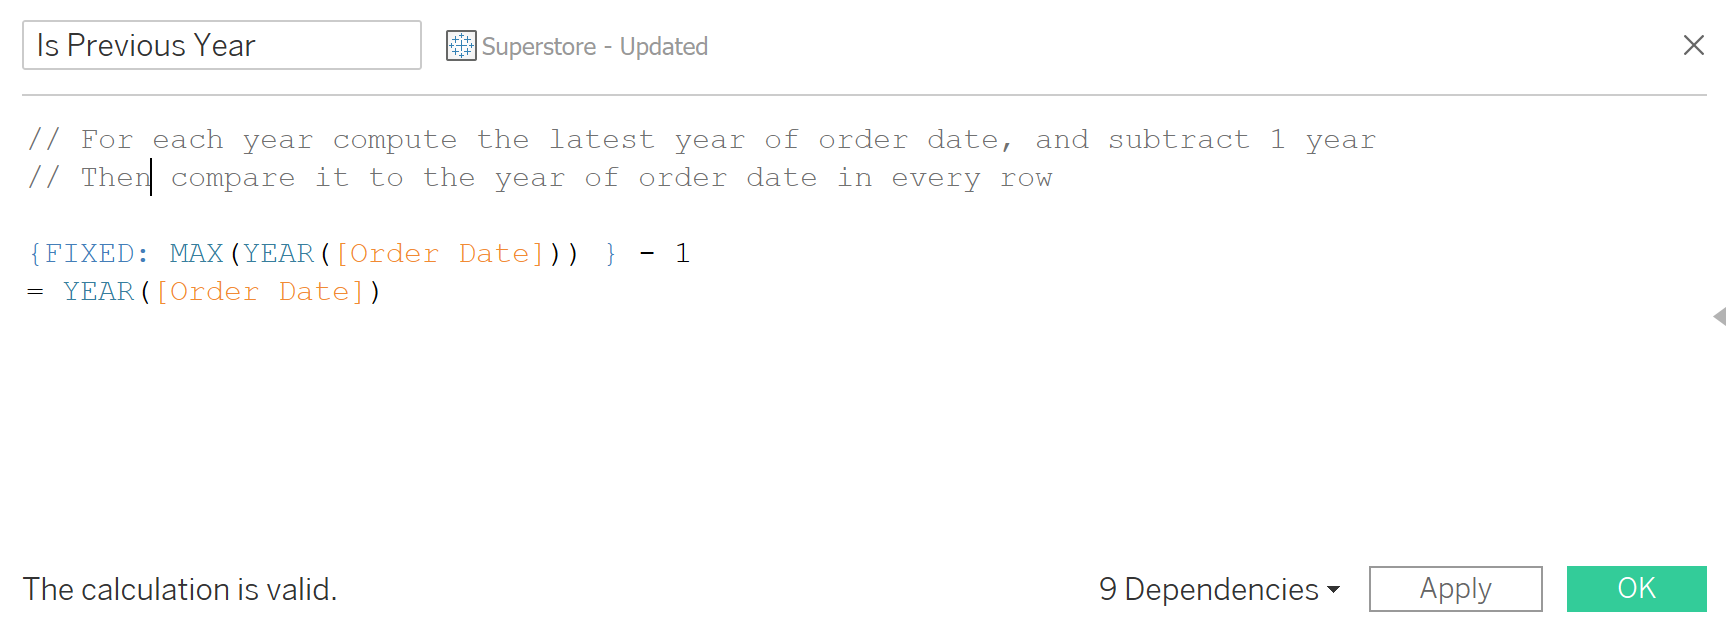
{FIXED: MAX(YEAR([Order Date])) } - 1 = YEAR([Order Date])#2. Create sales calculations for the latest and previous years, as follows:
Latest Year Sales = INT([Is Latest Year]) * [Sales]
Previous Year Sales = INT([Is Previous Year]) * [Sales]
We use the INT function because the output of our calculation in the previous step (#1 above) is a Boolean (True/False). So, we want to convert that to an integer (1/0) so we can multiply it by Sales.
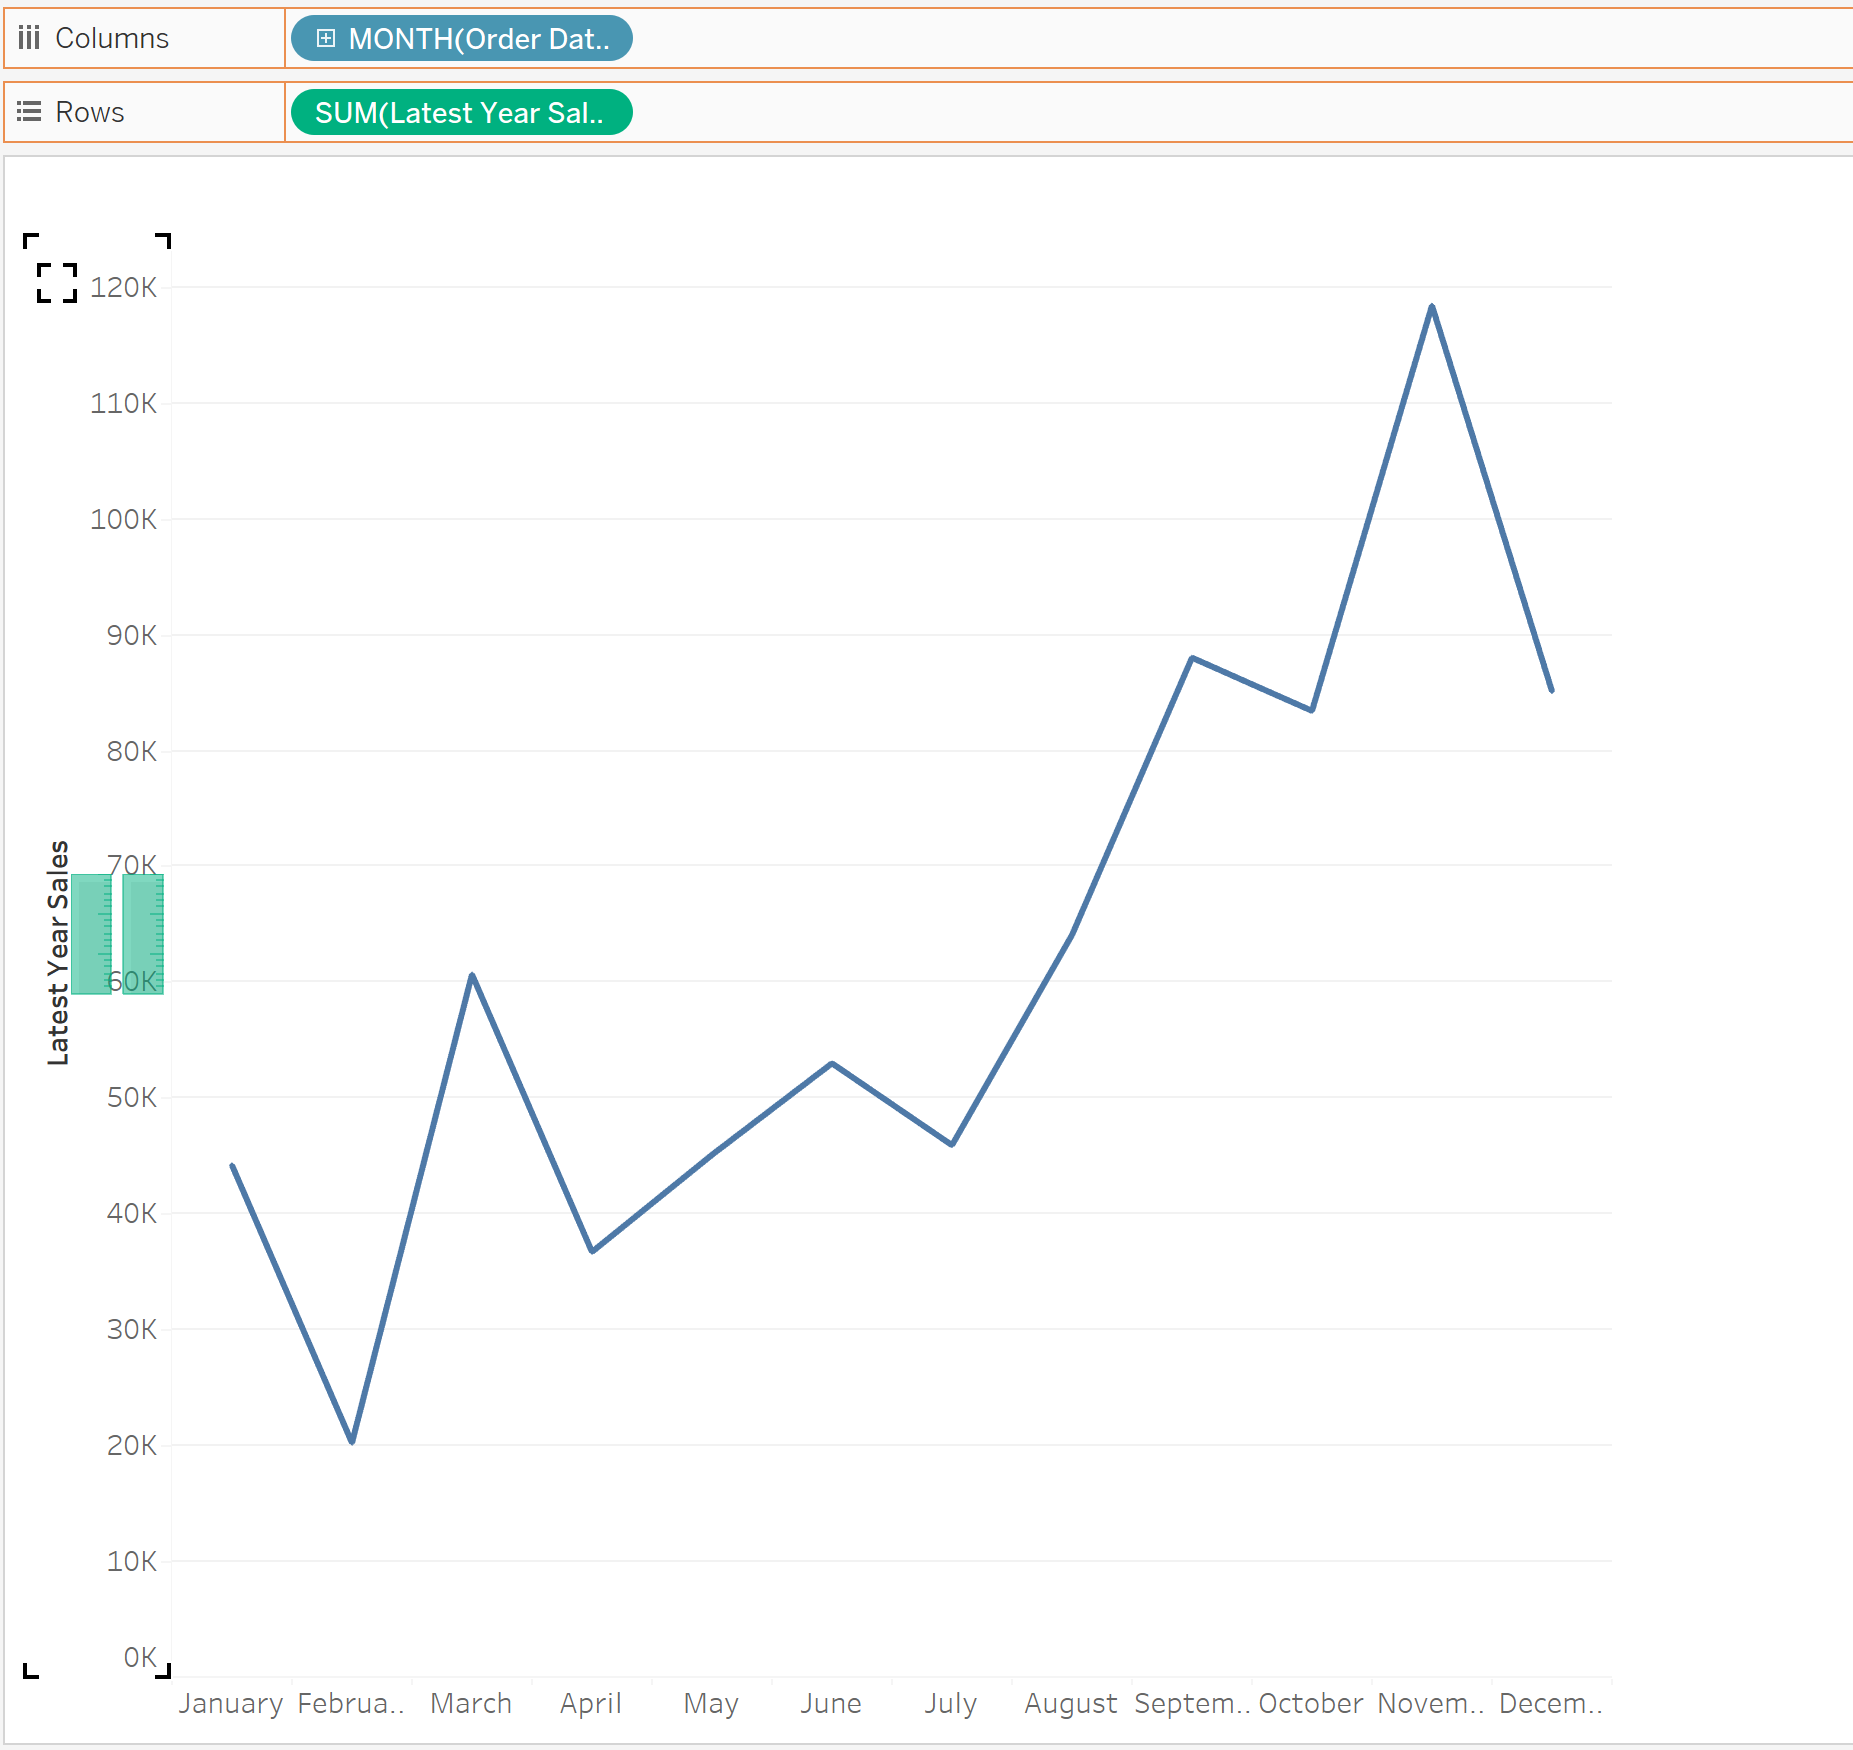
#3. Bring the first 3 fields into the view:
- Drag the Order Date (Discrete 'Month') to the columns shelf
- Drag the Latest Year Sales field to the rows shelf
- Drag the Previous Year Sales field into the same chart, by dragging the field to the y axis, and dropping it once you see the rulers appear on the edges as shown:
#4. Now, for the latest year, we want to compute the total sum of sales for the year (this is what we'll show as the big number in our chart):
Latest Year Total Sales = {SUM([Latest Year Sales])}
#5. Create a new calculated field for our % change of sales compared to the previous year.
YoY % Change = (SUM([Latest Year Total Sales]) - SUM([Previous Year Total Sales])) / SUM([Previous Year Total Sales])
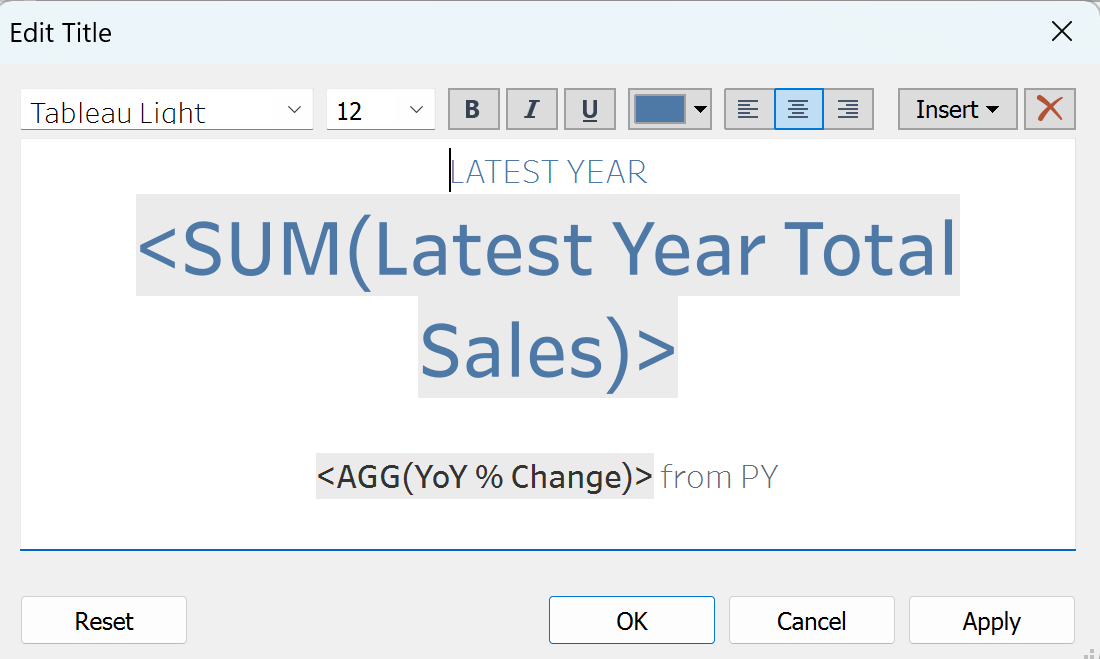
#6. Drag our two calculated fields of interest onto the Details card. This would allow us to use them in our title.
- Latest Year Total Sales
- YoY % Change
#7. Double-click on the title section of your chart. Use the Insert drop-down menu on the top-right corner to bring in calculated fields into the title.
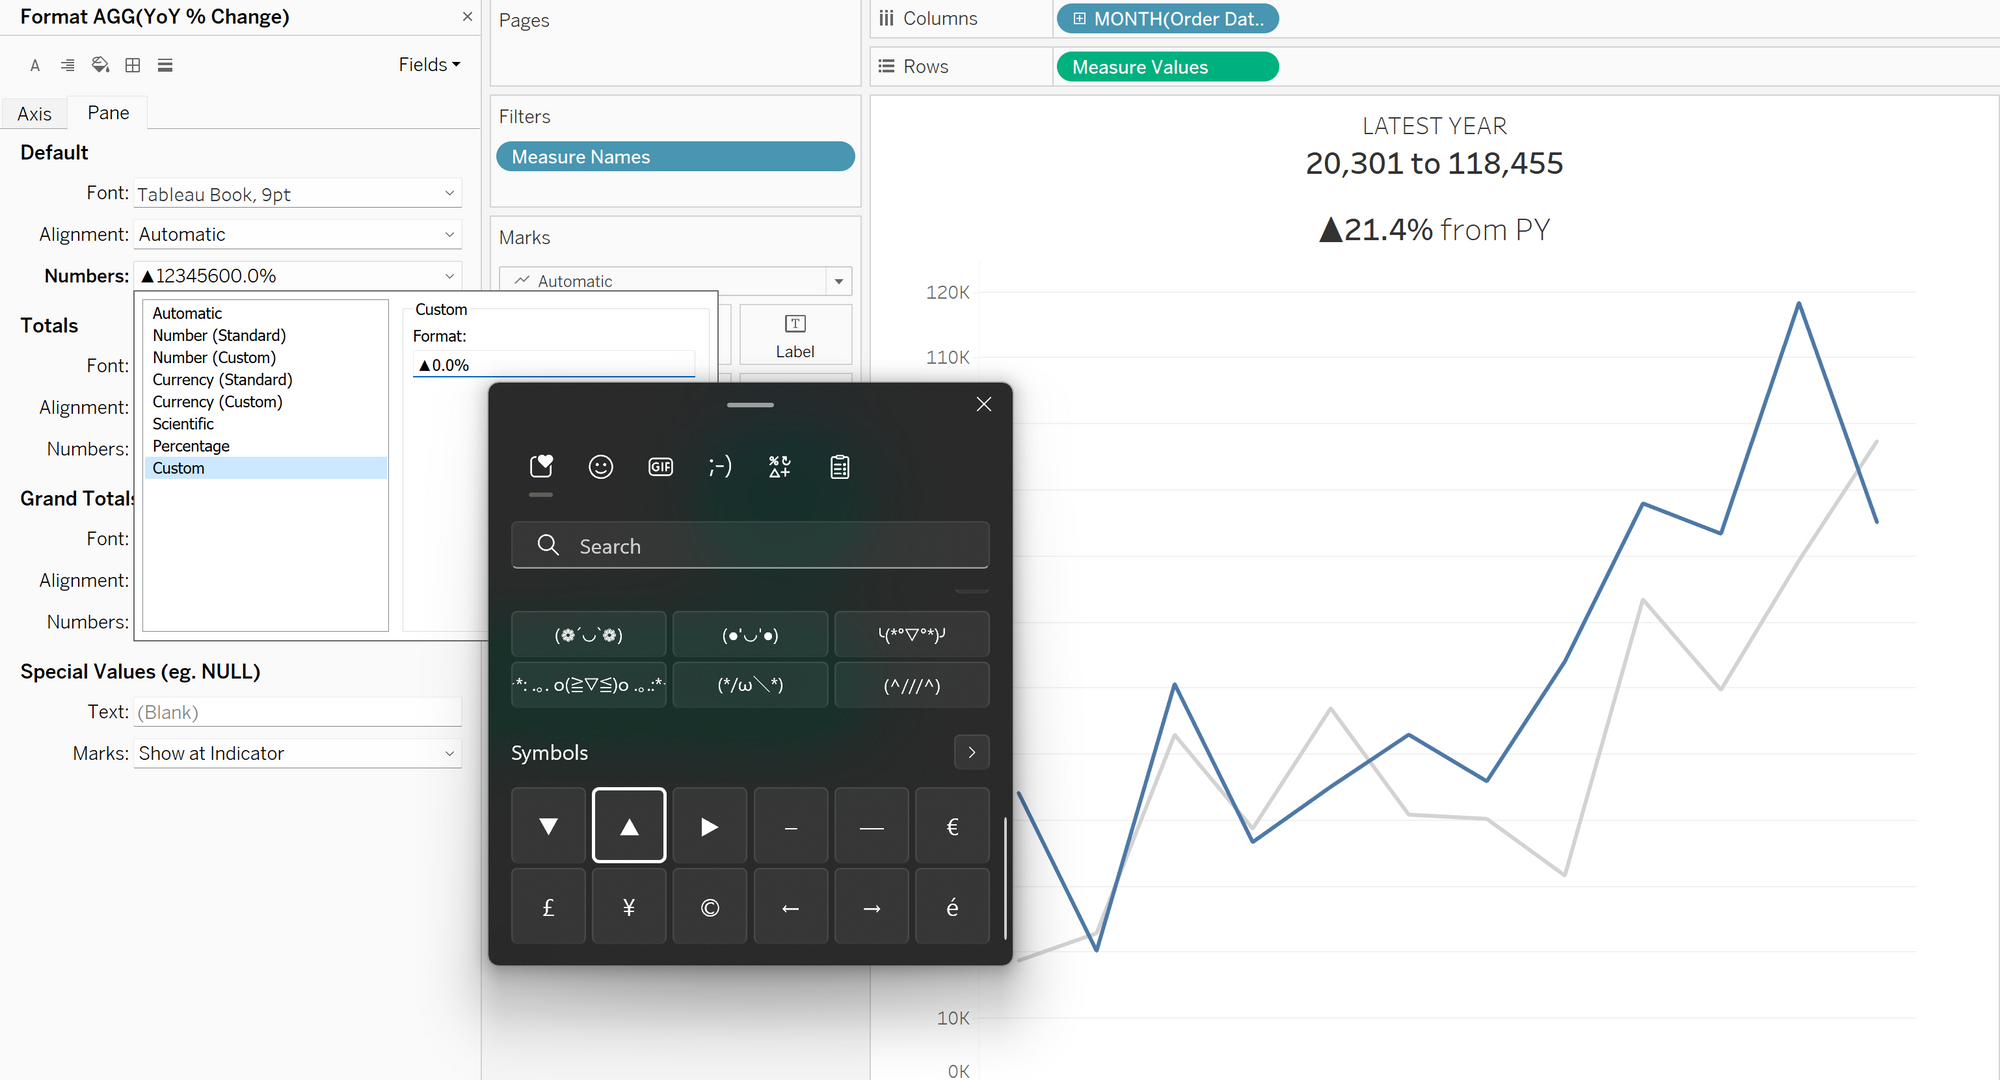
#8. To create the symbols for our % change, go to the YoY % Sales calculation in the data pane, right-click on it, and select Format
- Under Percentage, specify 1 decimal point
- Then under Custom, use an emoji keyboard, as shown below, to add the symbols you'd like to use. (The shortcut to the emoji keyboard on a Windows laptop is
Windows + .)
The syntax is:Positive Values; Negative Values, Zero
So, it you'd like to use an upwards arrow for positive values, a downward one for negative, and a dash for zero, your syntax would look something like this:▲0.0%; ▼0.0%; -
#9. Format the fonts and colours as you like!