


A few weeks ago, when leading a teaching session for The Information Lab's Training Day, a participant asked an interesting question: why, when creating a Profit Ratio calculation in Tableau Desktop, do we use the syntax SUM(Profit)/SUM(Sales) instead of simply Profit/Sales?. This prompted me to write a blog post on the reason, which goes back to how granularity and aggregation operate in Tableau.
Granularity Defined:
Granularity refers to the level of detail for a piece of data, determined by the combination of categorical fields. As data becomes less granular, representing a higher level of detail (as pictured in the example below), it transforms into aggregated data. Aggregation, in this context, refers to how data is combined.

The way Tableau performs calculations depends on the aggregation of the data, meaning it relies on the level of granularity within the view.
Exploring with an Example: Profit Ratio Calculation
Consider the Profit Ratio calculation with the Sample Superstore data at the lowest granularity level, i.e., Product ID. At this detailed level, both Profit/Sales (in orange) and SUM(Profit)/SUM(Sales) (in green) yield the same values.

Now, when we decrease the granularity to only category and sub-category, the ratios diverge – the values for Profit/Sales are significantly larger.
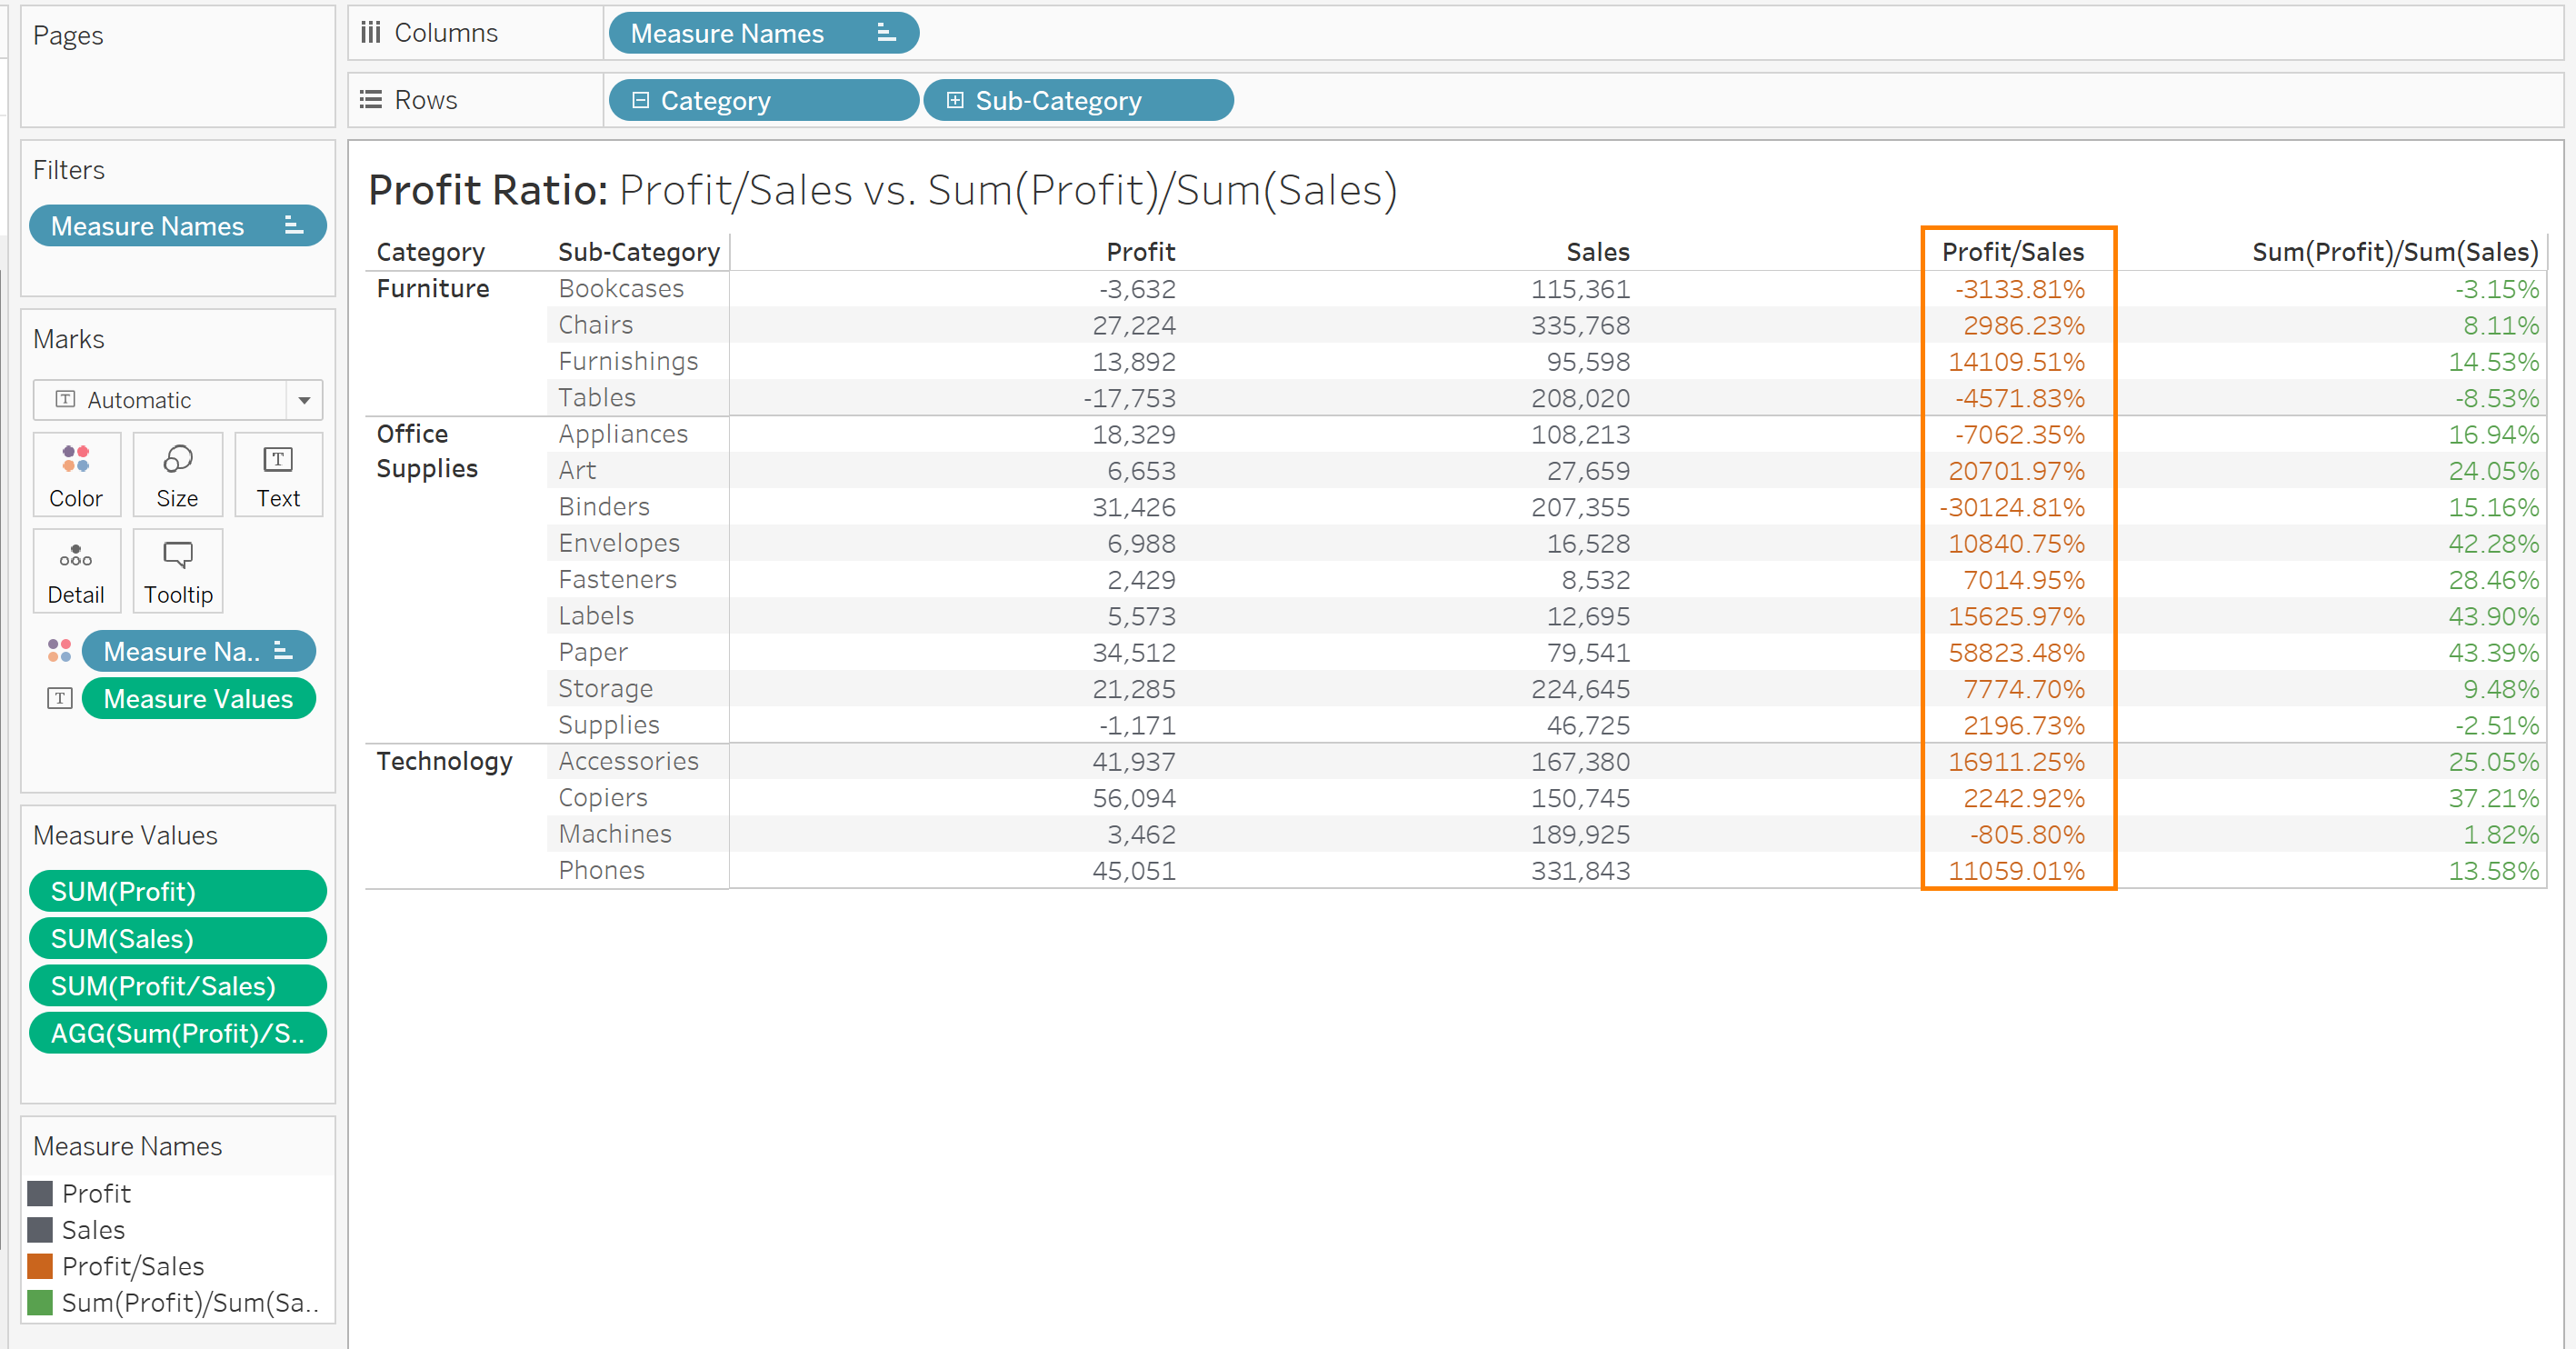
Why the Discrepancy?
When Tableau computes the Profit/Sales calculation, it does it at the lowest level of granularity in the data, then sums up the ratios to the requested aggregation of the view. In this scenario, it calculates the profit ratio for each Order ID and then sums up those ratios for each sub-category. That's why the resulting numbers are really big.
Below is an illustration from Excel to demonstrate what's happening behind the scenes, using one of the products as an example:

In contrast, the SUM(Profit)/SUM(Sales) calculation first sums the profit and sales for each sub-category, then calculates the ratio based on the aggregated numbers. By embedding the sum in the ratio calculation itself, we instruct Tableau to compute the ratio according on the granularity of the view.
Below is an illustration from Excel to demonstrate what's happening behind the scenes, for the same example:

Summarizing the Distinction:
Profit/Sales computes the profit ratio at the lowest level of granularity and then sums the ratios to the requested aggregation in the view.
SUM(Profit)/SUM(Sales) sums the profit and sales to the granularity of the view and then computes the ratio at that aggregation.
Understanding this interplay between granularity and aggregation is crucial for accurate and meaningful data analysis in Tableau. It ensures that the calculations align with the desired level of detail in your visualizations.