


For the last challenge of dashboard week, our task was to submit a viz for the Data + Movies challenge by Tableau, which meant a sweet reward: a cool free t-shirt from Tableau!
Here is my plan for the project:
Getting Started
- Brainstorm some questions that are interesting to me
- Explore the dataset and define user story
- Refine the questions I want to answer based on the available data
Explore additional data to add- Check scope with coach
Sketching & Visualizing
- Browse for inspiration; brainstorm with others
- Sketch
- Explore additional data to add
- Ask questions; seek clarification
- ---
- Pivot and create new sketches given I can't find year-on-year sales for books
- ---
- Build visualisations on Tableau
Put it all together in a dashboard
- Identify colour scheme, fonts & layout
- Bring all the charts together
- Add context and insights
As an avid reader, I really enjoy film adaptations. So, I wanted to explore films that have been adapted from books. Before exploring the data to see what's possible so I can narrow down, I brainstormed some questions that I thought would be fun to answer:
- Films adapted from books (maybe narrow down to Sci-fi films)
- What book genres are often adapted to films?
- Have film adaptations increased over time?
- Did book sales increase after the film was released?
- Movie ratings vs book ratings
- Book revenue compared to film revenue... Can I standardize this for a fairer comparison?
- How often are authors involved in the making of the film? And when they're involved, do they result in a better movie?
- Oscar nominations/awards
- For the ones I've watched, my rating vs average rating
- Do critic ratings differ from average viewer ratings for these films?
- Does the language differ from the language of the book? My sense is most adaptations would be in English regardless of the book language
- For sci-fi ones, how accurate is the Physics? : D
After a chat with one of our coaches, Jenny, I quickly realized that while these questions were indeed interesting, the scope was way too wide. So, I narrowed it down to focus on a particular film franchise: The Lord of the Rings. I defined my user story as follows:
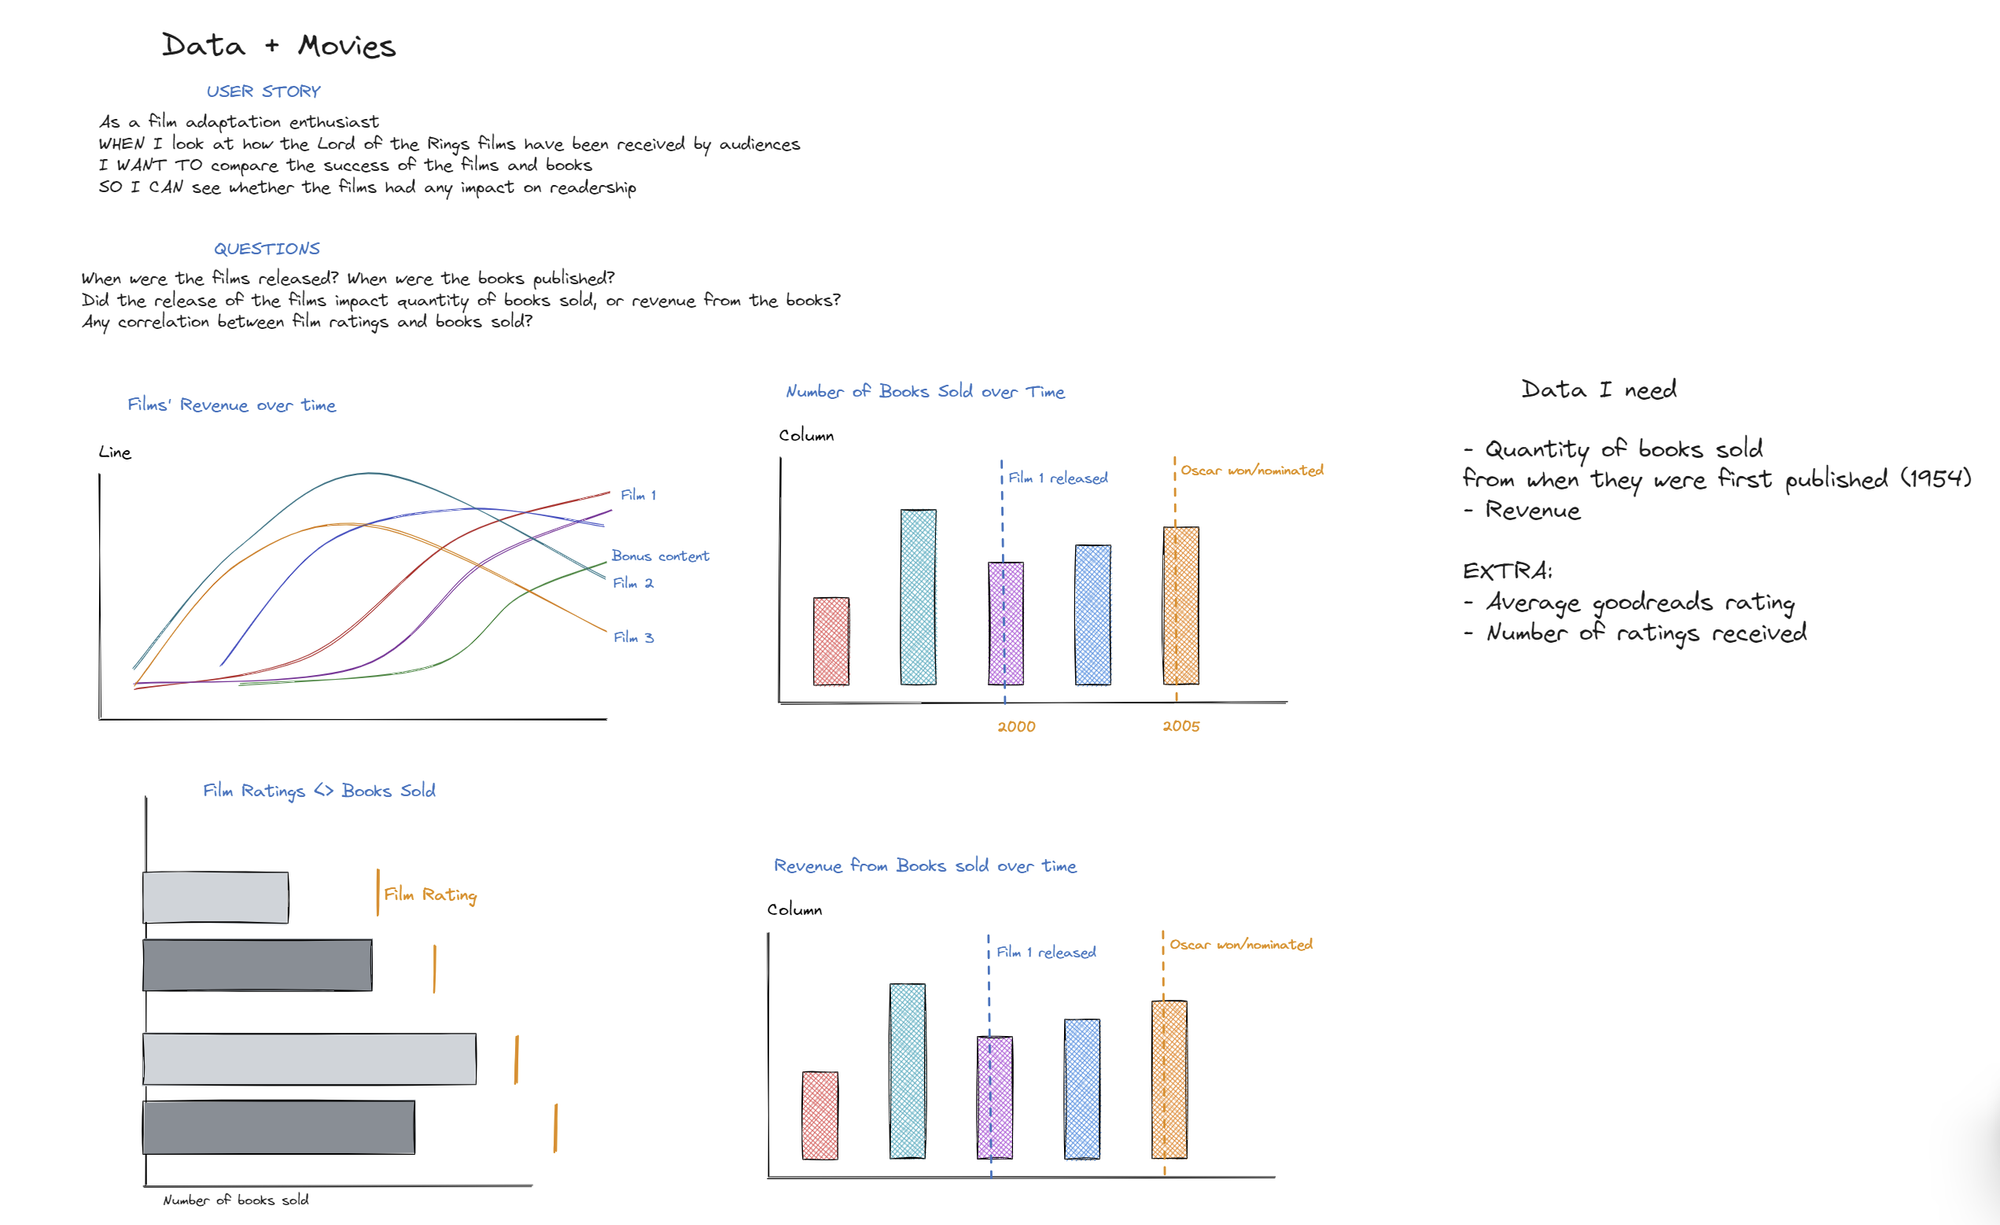
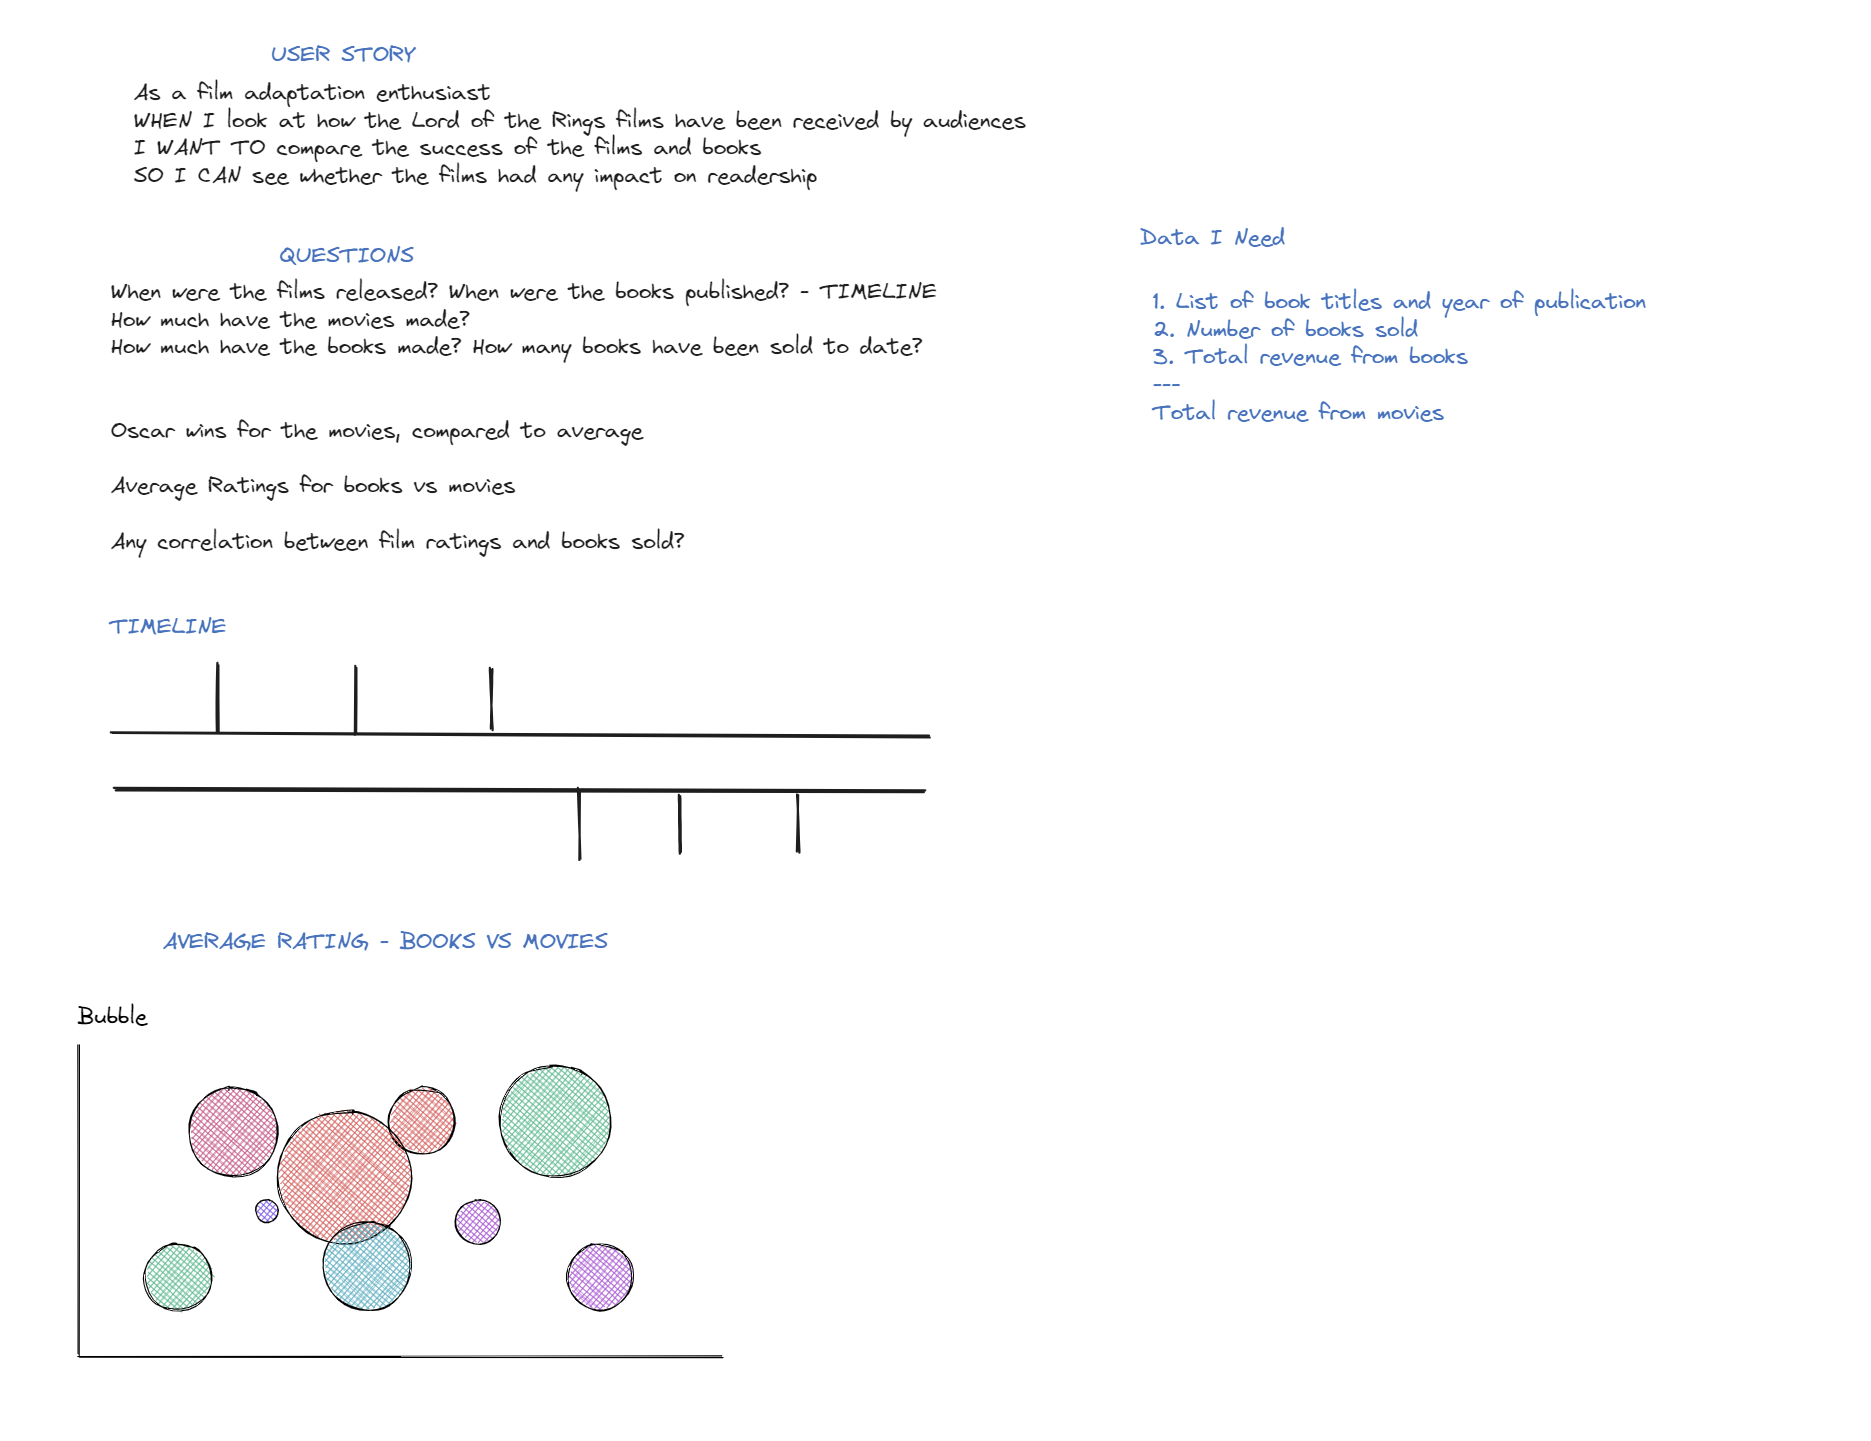
AS A film adaptation enthusiast WHEN I look at how the Lord of the Rings films have been received by audiences I WANT TO compare the success of the films and books SO I CAN see whether the films had any impact on readership.
And had the following key questions to start with:
- When were the films released? When were the books published?
- Did the release of the films impact quantity of books sold, or revenue from the books?
- Any correlation between film ratings and books sold?
These were the initial sketches I started with:
Given the book component, I knew I'd need additional data on book sales. My research, however, yielded nothing. The Lord of the Rings book sales numbers are infamously difficult to track down. The only official statistic out there is: over 150 million copies sold. I couldn't find any data on year-on-year sales or revenue.
By the afternoon, I decided to pivot and use what data I could find on lifetime revenue for all the books, and goodreads ratings (as a proxy for the number of people who've read the books).
At these point I started some sketches for this new direction, but overall, focused on building on Tableau given the data I had:
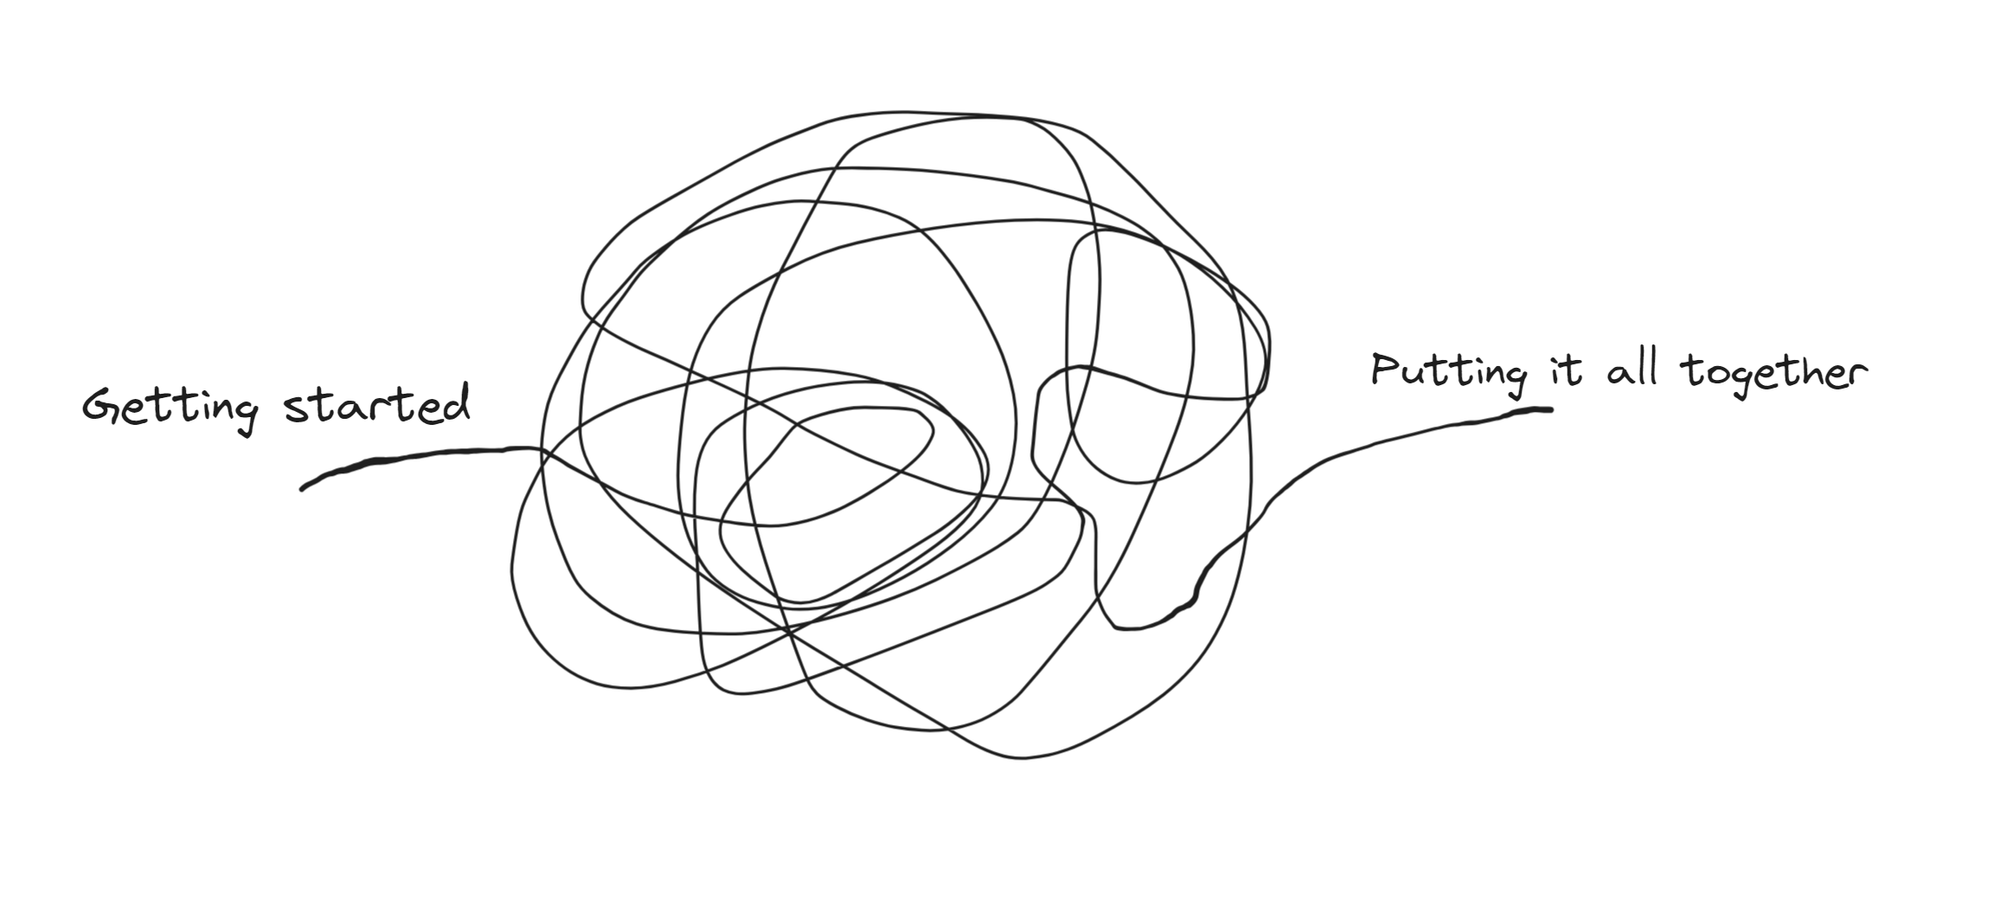
The rest of my process was rather messy (illustrated below), going back and forth between what I could analyze and finding more data for gaps that were coming up.
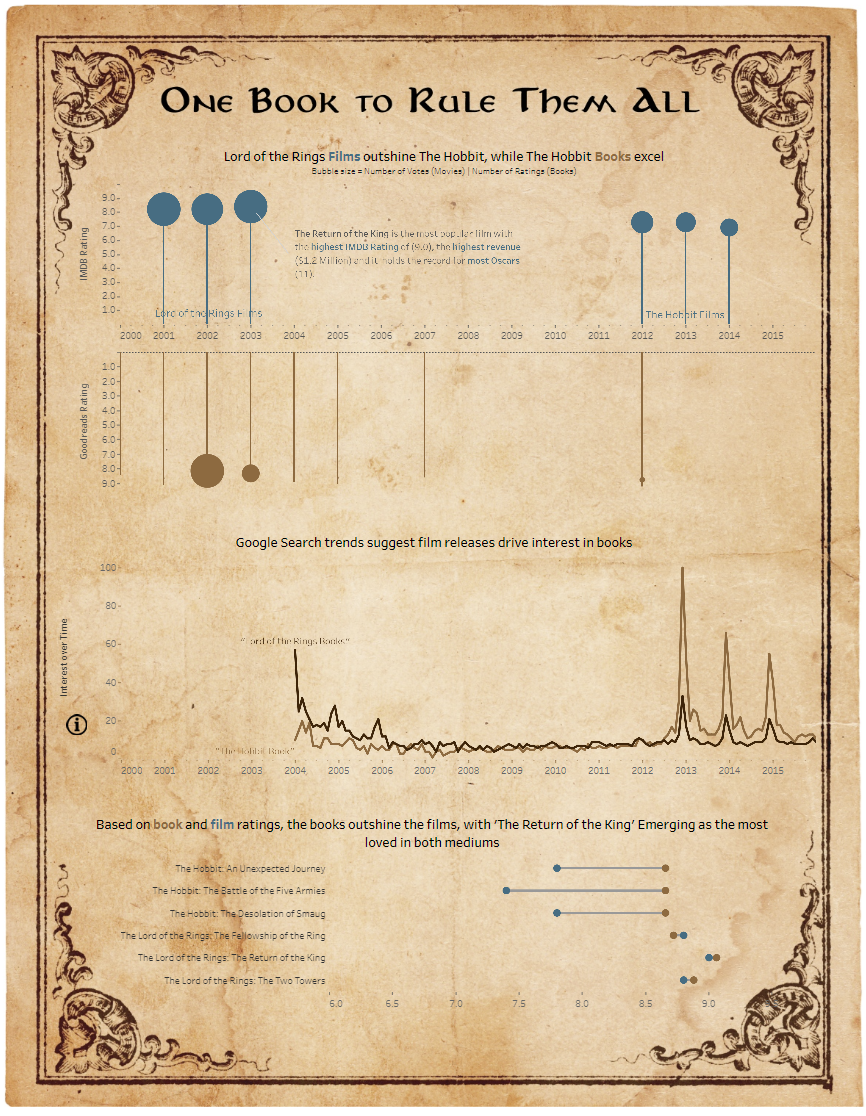
By the end of the project, this is what I designed (lined on Tableau Public here):
I definitely plan on revisiting this project soon to see if I can find more data and build on it.