


During training this week we were told that one of the charts that never fail to impress stakeholders and clients are map charts. I have created a few classic map charts previously but I wanted to amp up the difficulty, so taking advantage of week 48 #MakeoverMonday I decided to tackle how to create hex maps today.
After an extensive amount of research and trial and error, i have put together a step by step guide on how you can create them yourselves. Enjoy:
Step1: Download Hexagon shape into Tableau repository folder (this PC>Documents> Tableau repository)
Step2: Download THIS file to create the US hex map template
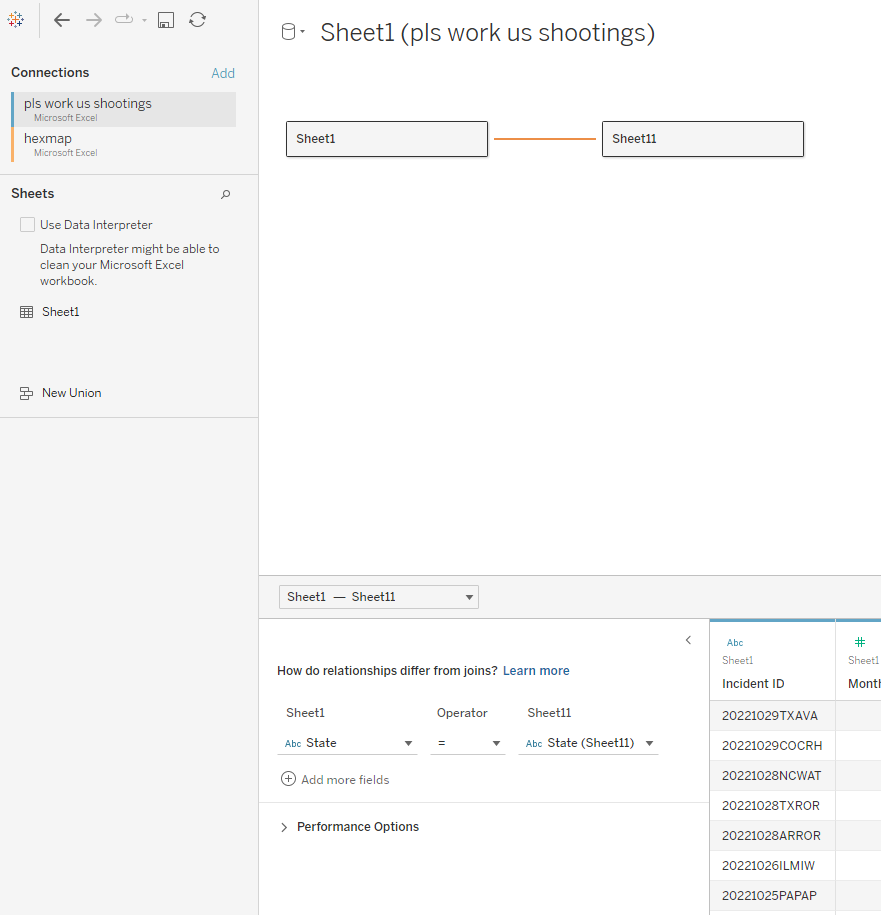
Step3: Join your data from state=state
Step4: Add rows to rows and columns to columns
Step5: Reverse rows axis
Step6:Change marks to shapes and choose your hex shape
Step7: Drag Abbreviation to the label, set the vertical and horizontal alignment to center, turn on allow labels to overlap other marks
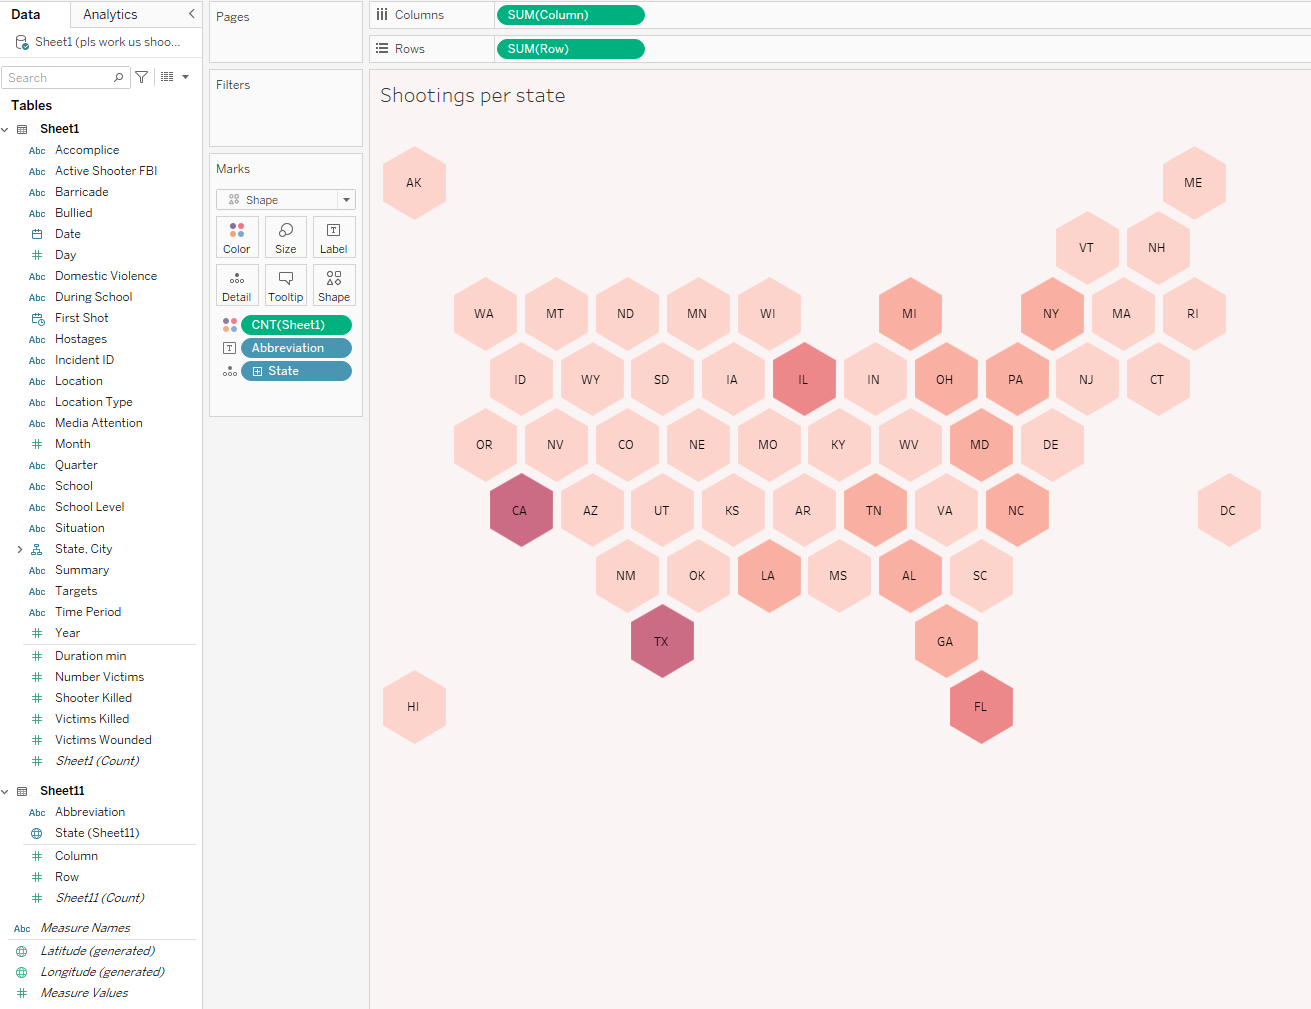
Step8: Adjust the sizing
And you're done! Now you can add it to your viz.