


When originally applying to the data school i looked at previous applications and what it too to get in. Many of these had a lot of customization down to the smallest detail, and I found that really cool.
I looked into it and found its actually not that hard to do, so here is a little blog on how to do it so you dont have to explore all of tableau desktop to find out how.
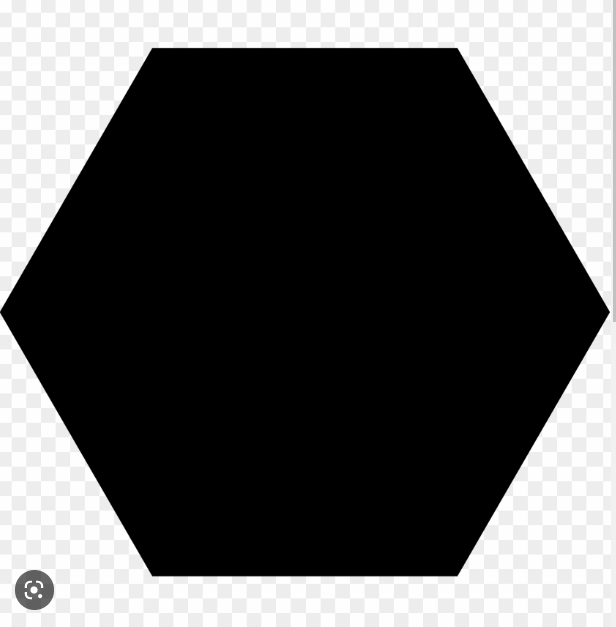
1)Find a png image of your liking:
look for an image without a background of your liking or one that takes up a whole square image. You can normally tell if they're a png or not from them having this checkered background
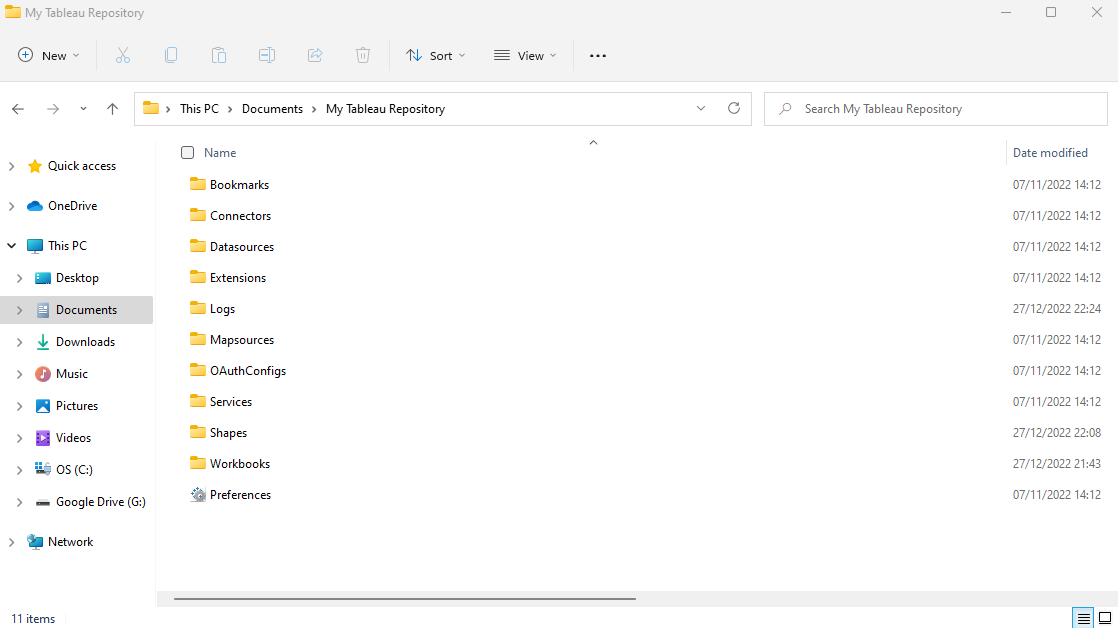
2) Locate your tableau repository:
most likely you will have the same file path as me but if you dont you can also just type in the search bar
4) Go into shapes and create a new folder
In this case I am saving a hex to create hex maps so i will name the folder accordingly

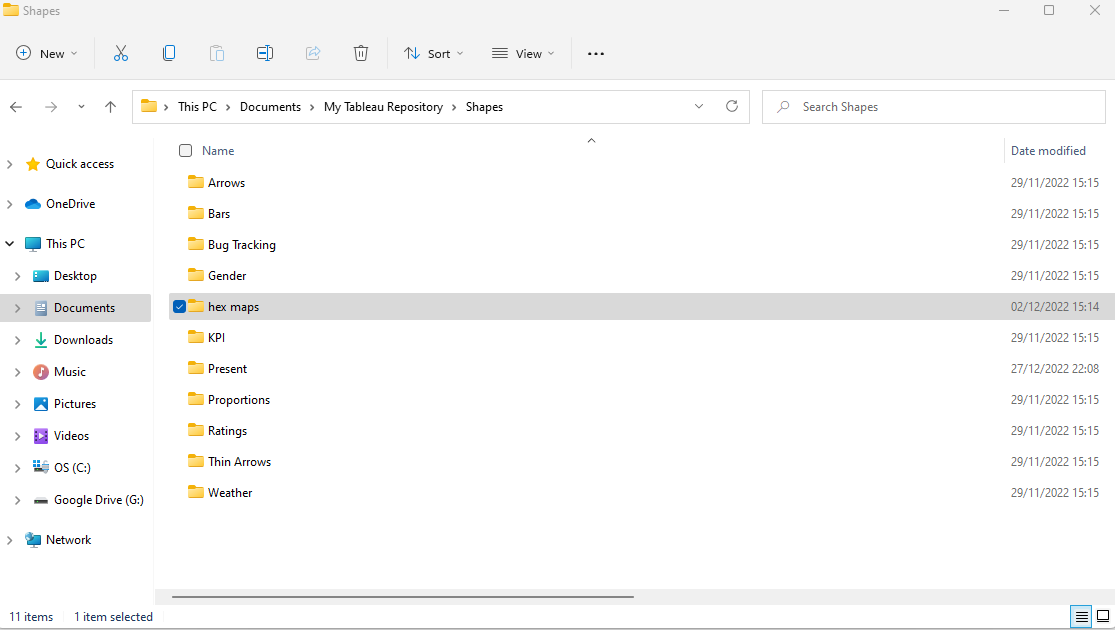
5) Save the image in the newly created folder

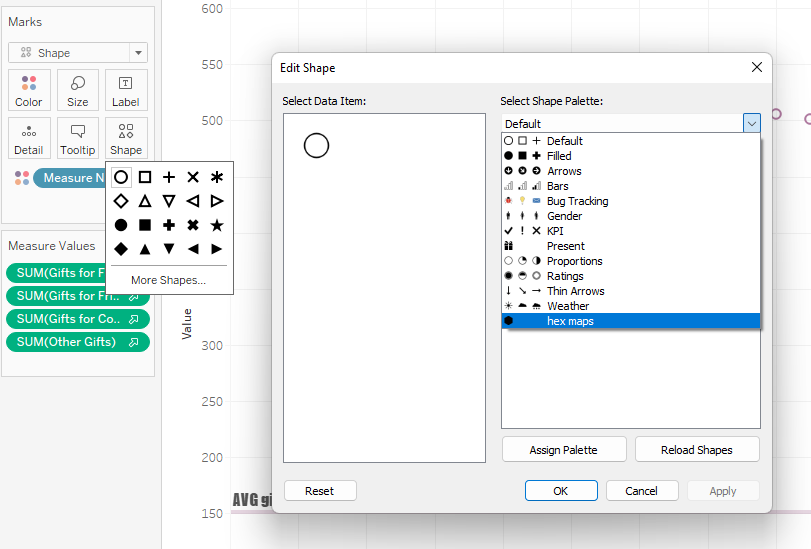
6) Use to create fun charts
And thats all! such a simple way to make your dashboards more attune to the topic and just that bit more fun to see.