


For those of you new to Alteryx, here is a useful guide on how to use the data connection tools and some examples:
What can I use them for?
They can be used to combine multiple data sets without the need of long and time consuming manual labor that can also include human errors. A real life example on how it would be used is a brand owner who sells t-shirts across multiple branches. He receives multiple excel reports from each branch weekly but he needs a combined data set to be able to analyze any consumer trends and stock deficiencies he might have.
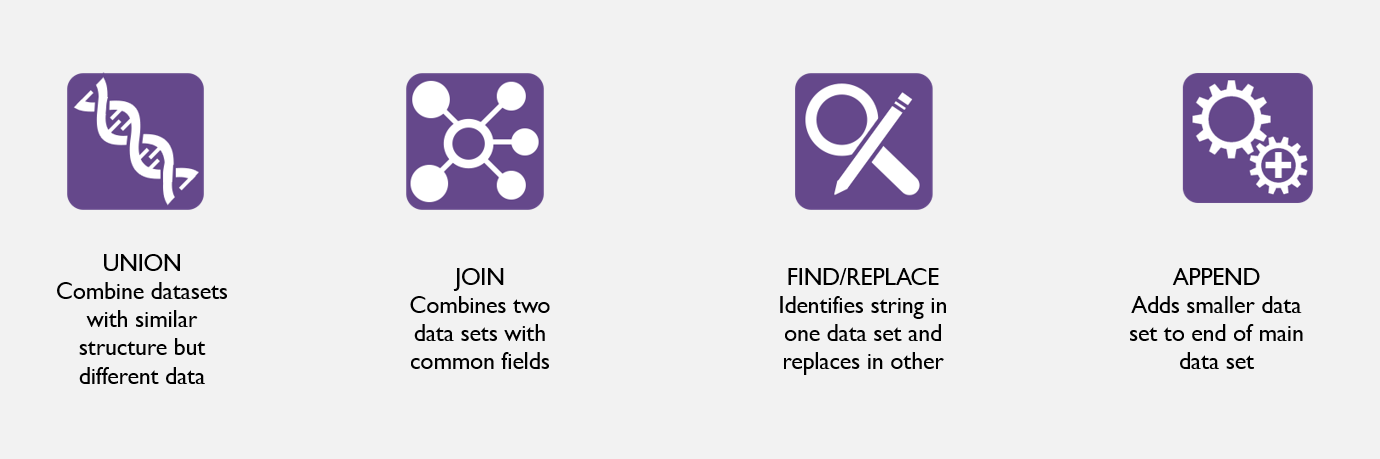
What tools do I use?:
To further illustrate how each of these tools works, below i will attach an image including what the toll looks like when used on alteryx as well as the two data inputs and the final data output the tool spits out when running through it.
Union types and example:

You can connect data sets trough the union tool which have a column name or columns in the same position in common. if neither of these options suit your data, you can also manually adjust it. above we see the first and second data inputs and below the arrow the final outcome.
Join types and examples:
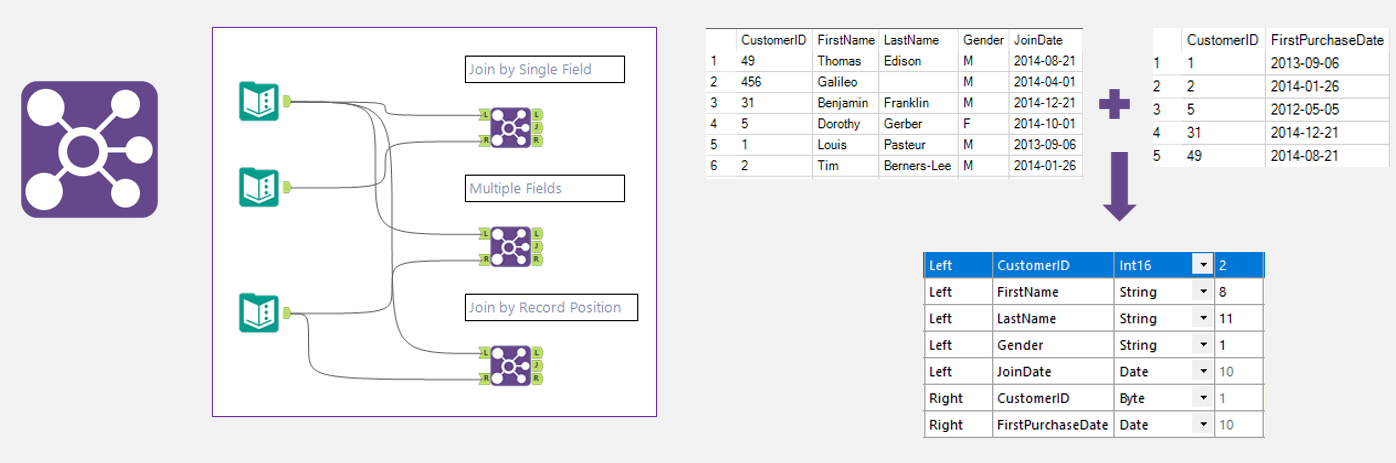
We can join multiple different data sets when they include something in common such as one or many fields, or when they have the same record position. If input A (left) and b (right) are run through the join tool, we can see a menu displayed letting us select which fields they have in common and we wish to include. As we can observe there is a little arrow with an L for left and R for right. Out of these two arrows we can see any data that has been spit out of each data set because alteryx did not find a match.
Find/Replace types and example:

Find and replace does exactly that, it finds either a value, word or a section of the string selected and replaces it with whatever the second data set indicates it should replace it with. In the image we can see the main data set above and the words we want to replace the values with, leaving you with the final outcome with already replaces values and words.
Append types and examples
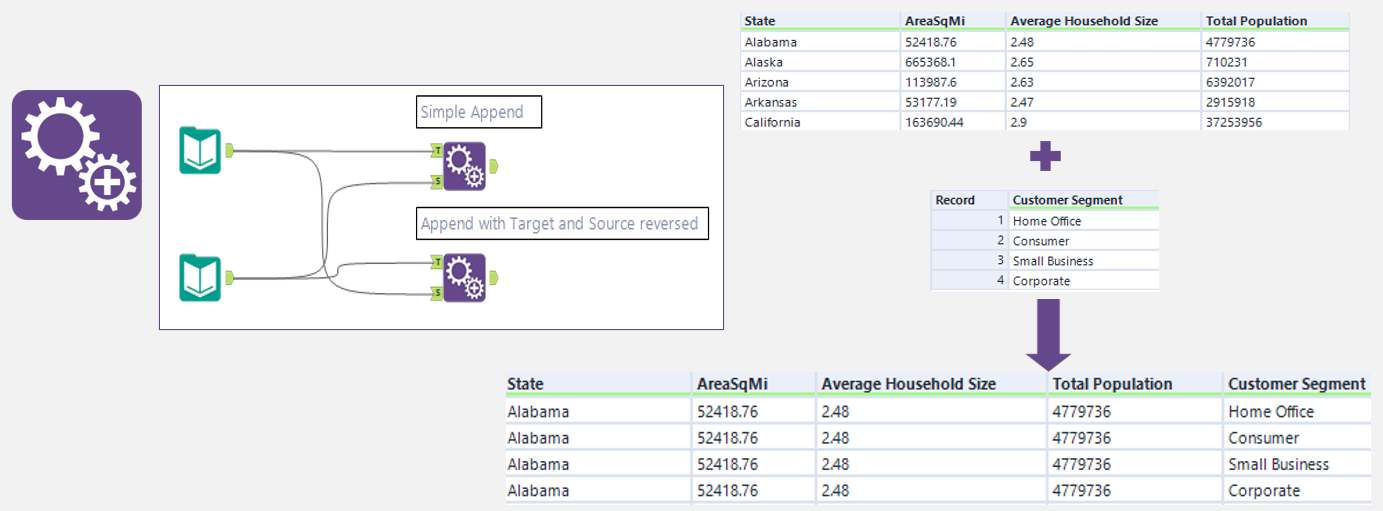
To understand the append too we will need to understand some terminology first. the "target" data is the main body of data which also tends to be larger, and the "source" is the smaller data we want to add to the main data input. These are shown in the little green arrows on the left hand side of the append tool. To "append" basically means to add onto, so in this case we want to append the customer segment onto the target data. You can chose the simple append that just adds it onto the end or you can chose reverse, which will add it on the first column of the target data.
Based on what you want your final output data set to look like, decide what tool would best suit you situation and save as a CSV file (recommended but not necessary). We can then input this file to Tableau to create a visual dashboard on the trends and patterns that arise from your data.