


As always tableau surprised me today with another basic feature i did not know existed. This time its: Annotations! Today we will be focusing on point annotations but I will be writing a separate blog on Area annotations as they have a variety of uses so stay tuned for that!
HOW TO ACCESS THEM
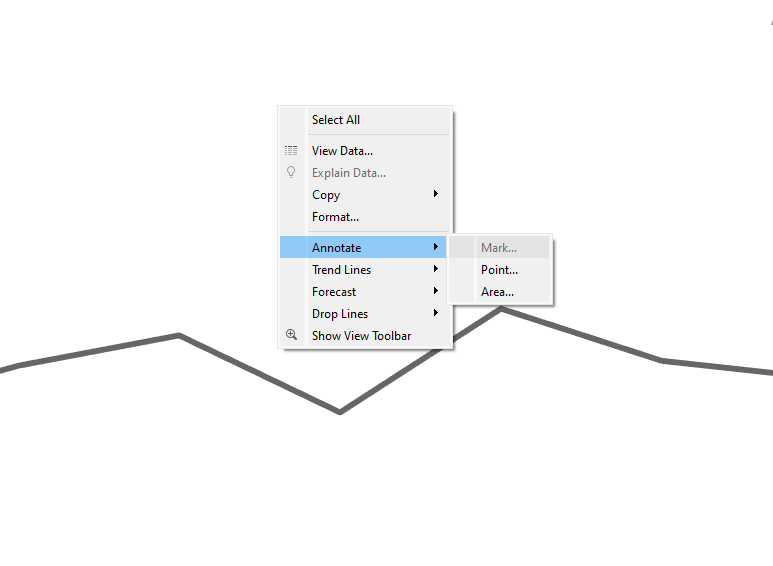
To access them you will just have to right click on your tableau desktop canvas, look for the annotate option and then select the type you would like, in this case 'Point'.
HOW TO USE THEM?
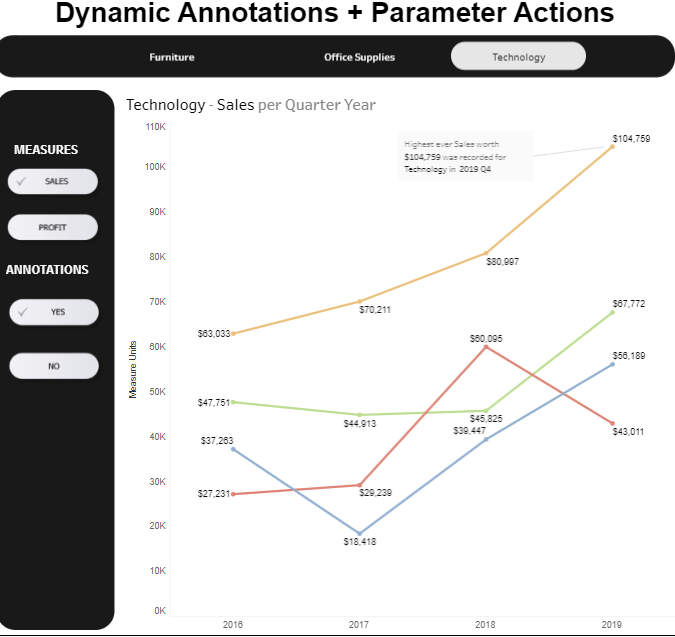
A point annotation would look something like this:
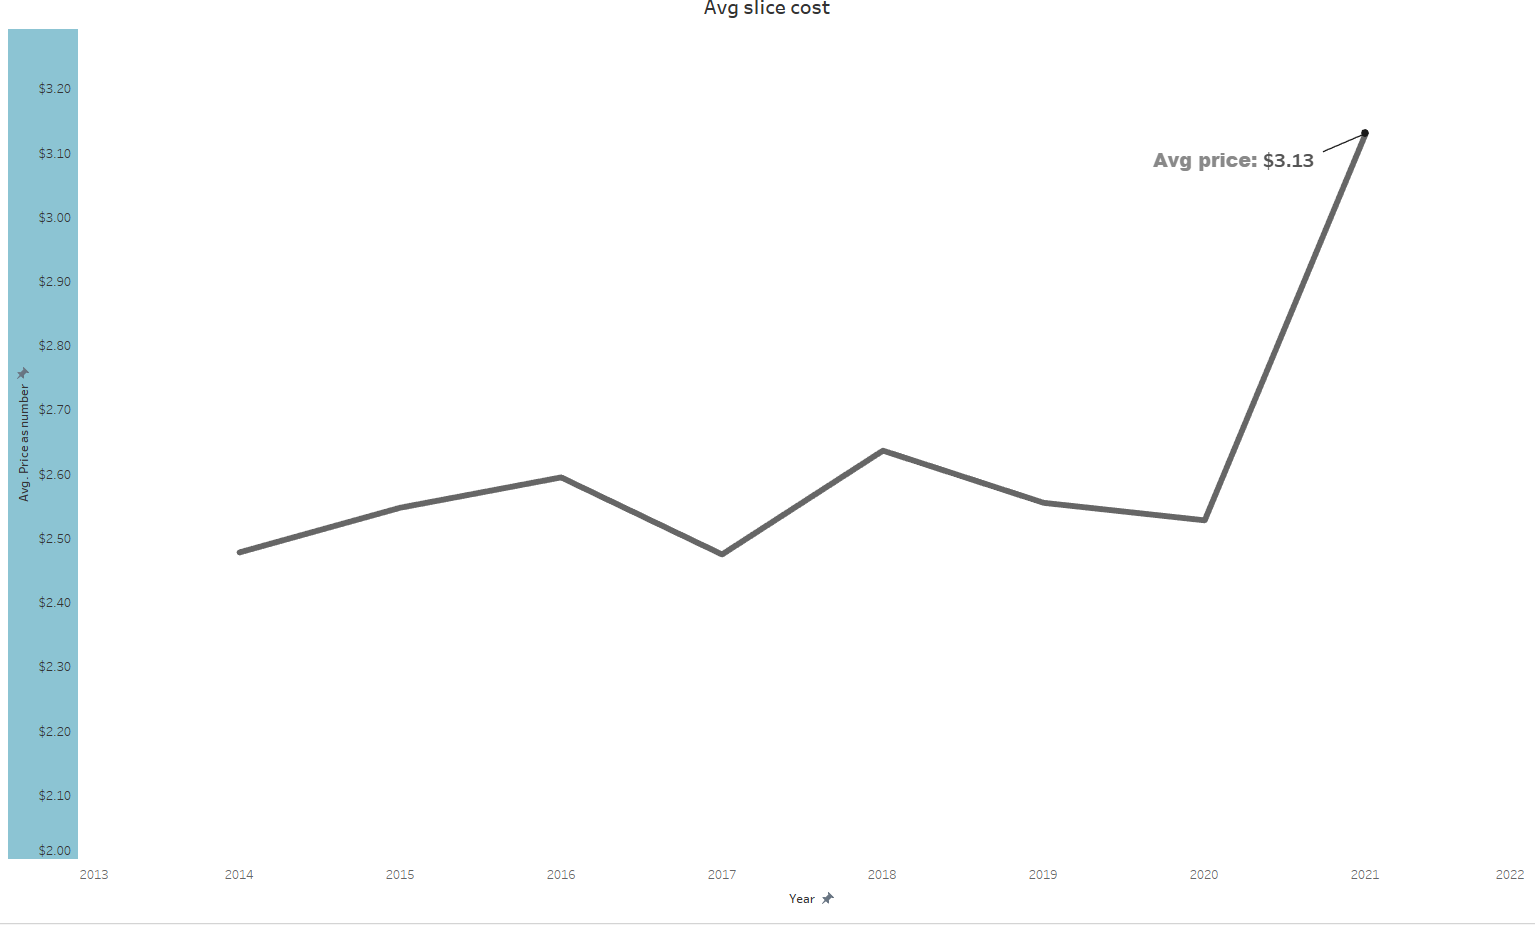
It is mainly used to point out specific points on you graph, including segments or specific numbers in your line charts.
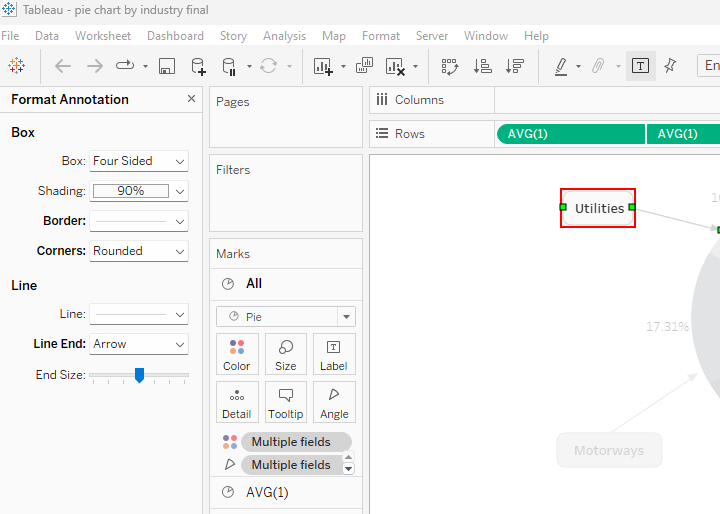
It has many customizable options. To access them you just need to right click on the annotation and click on format.
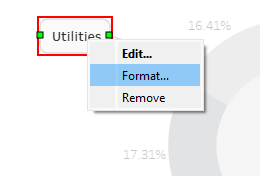
Here you have many options to customize such as border shape, line width and color, line ending (arrow, dot, open) etc.
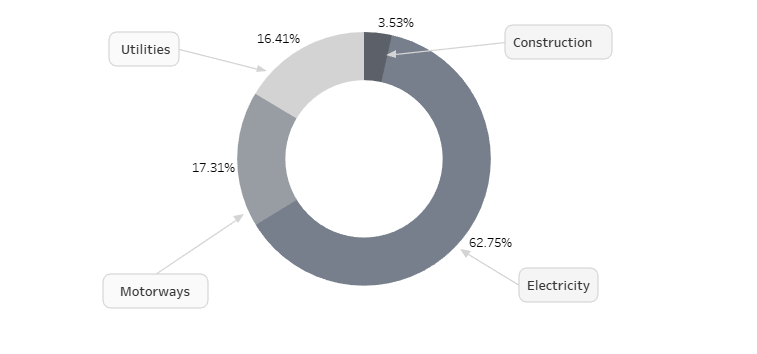
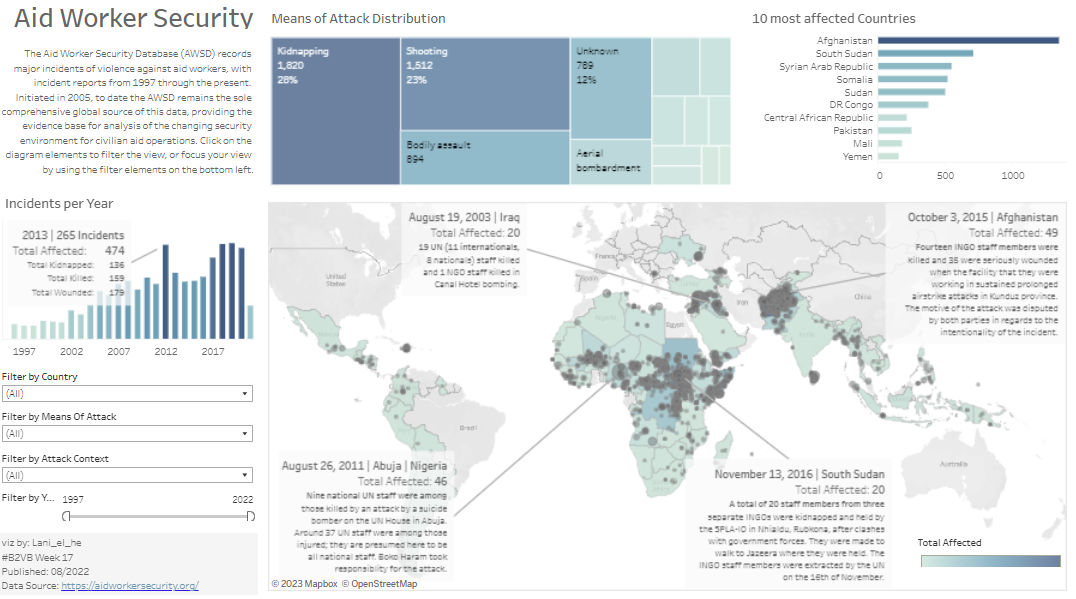
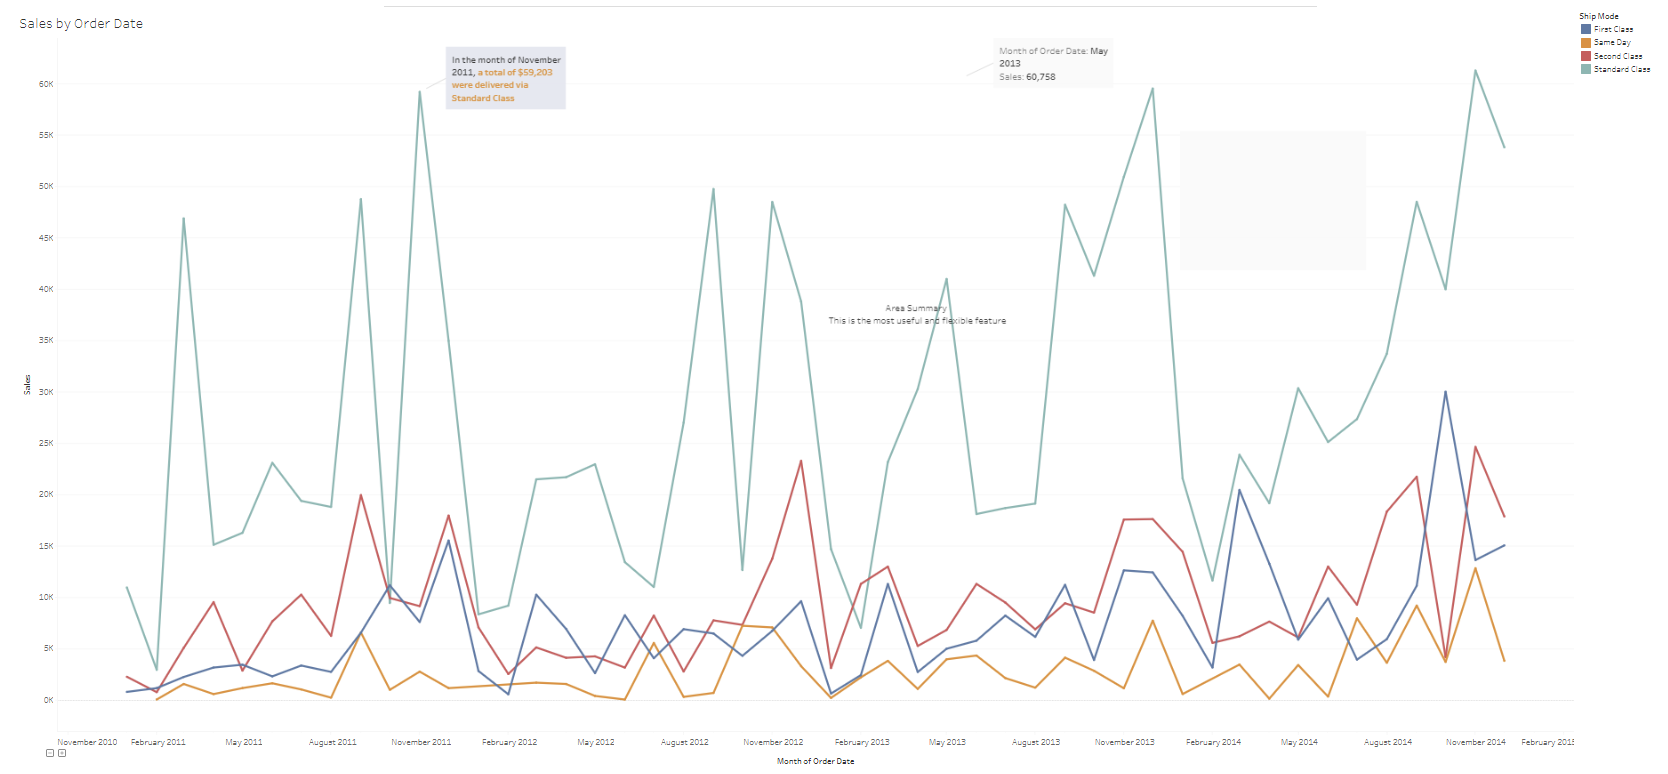
EXAMPLES OF USE (from tableau public)
Its an easy and fast way to elevate your viz than can come in handy when wanting to point out specific things on your dashboard. To also learn about area annotations you can access my blog here: