


If you told me a year ago that I would be here today at The Data School, I would not have believed you.
If I were to describe my application in one word, it would be unexpected. Unlike other applicants, I attended The Data School open house solely to support my COOPers/students, I was not eyeing a new opportunity at all. In fact, I was only a few months into my former position and still very new. Yet somehow the very inspirational Collin Smith, aka DSNY's recruitment lead, convinced me to give the application a try and I got in!
Anyways, the day has finally come and here I am opening this new chapter of my life with DSNY2. Now the big question is, how did I get in?
After connecting and meeting with the team post-open house, I decided to apply. I had just about two weeks to submit my first application and had no idea what to do. I changed my topic several times. Being a huge foodie, my first idea was to look at all the restaurants in NYC and determine which places were the best reviewed by cuisine. Unfortunately, I had difficulty finding an updated dataset that matched what I was looking for. So, I narrowed my topic to bubble tea stores and yet again there was a lack of public datasets reflecting what I had in mind. So, I attempted to create my own dataset, which I would HIGHLY ADVISE AGAINST unless you know how to scrape data or use APIs. Hours had passed and yet I had only scratched the surface. It was a huge mistake... I should have dedicated the majority of my limited time to working on my dashboard instead.
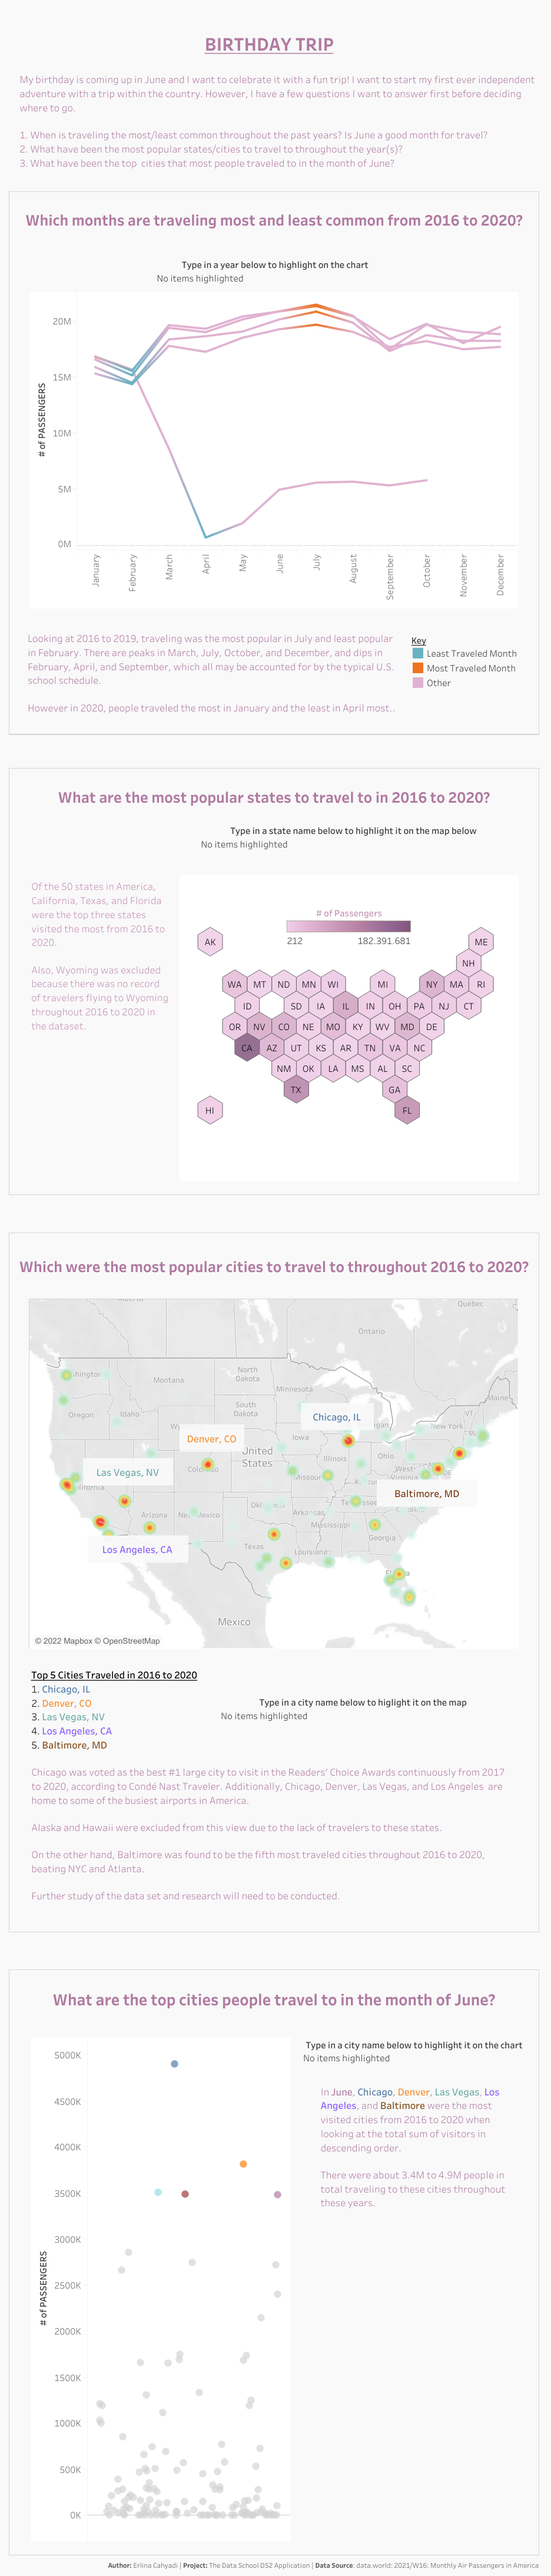
So what dataset did I end up using? At the time, I was also planning my birthday trip in June and I thought it would be a great idea to have my application decide my trip destination for me. So, I proceeded to write a draft of my story and developed more questions to build off my main question. Using a U.S. domestic flight dataset I found online (thank goodness), I started by creating tables to help visually determine the most and least popular states and cities to visit. The last thing left was to choose 3-4 tables, put it all together, make it look pretty, and submit my application.
Afterward, I received feedback to help improve my application dashboard and applied the changes to present on my zoom/phone interview with the lovely Ann, also known as the head coach of DSNY. Somehow I had impressed her and came out of the interview unscathed from criticisms (which I hear is rare).
Now the final interview was the last obstacle that I had left. Thankfully, I did not have to choose my own dataset and instead was given one consisting of the fat and nutrient contents in some of McDonald’s most popular foods and drinks. Luckily in this stage, although I had only about a week to complete my dashboard, I was also given a mentor to assist with any questions I had and/or tips on how to improve my dashboarding skills. For my project, I decided to ask the question of what to avoid in Mcdonald's as many individuals are unfortunately limited in their choices of food due to what they can and cannot afford in their day-to-day. Once again I made many visualizations and went through them with my wonderful mentor, Carlo Sanzeri, to get down to 3-4 tables that I would use on my final interview. After fixing up the tables, I put it all together into a dashboard, made it look pretty, and submitted my final dashboard to present in person.
The following day, I nervously presented to the team, answered some behavioral questions, and reflected some questions back to the team, which got them thinking of things to potentially consider. Later that week, I was invited to a zoom call and received the good news.
Now here I am. :)