Have you ever wanted to place a tool tip somewhere on your dashboard without being limited to only placing it inside of a table or chart? With a little bit of brainstorming you can dance around the limitations of tableau!
Why would you manually want to place a tooltip? Numerus reasons. Placing a tool tip inside of an image or word so that you can hover over it to give more context without having to take up more real-estate on your dashboard is a great example.
Step 1: create a transparent image/button. You can use a free editing program to do this. Figma. Paint. Photoshop etc...
Step 2: create a worksheet (worksheet 1) in tableau and make it a shape. Inside the tooltip option insert image that you want to be displayed when the user hovers over the desired area. You will need to upload your images for the tooltip. do this by going to Documents >> My Tableau Repository >> shapes then create a folder and insert your images you want to use.
Step 3: create another worksheet (worksheet 2) and change it into a shape. Click the shape button and select your transparent button. To do this upload your transparent button into tableau shapes by going to Documents >> My Tableau Repository >> shapes then create a folder and insert your transparent button.
Step 4: Now create a blank calculated field by typing "" into the field and drag the calculated field into columns.

Step 5: Now insert sheet 1 as a tooltip into sheet 2. Do this by going to sheet 2. clicking tooltip. Delete anything inside the tooltip field. Then click insert >> sheets. Choose the sheet you want to insert!

Step 6: Now to clean up sheet 1 and 2.Change to entire view. Change color of sheet to "none"(making it transparent). Hide the title. Hide field label for columns. Un-show header. Get rid of any cell lines or row dividers so that the worksheet appears completely blank!

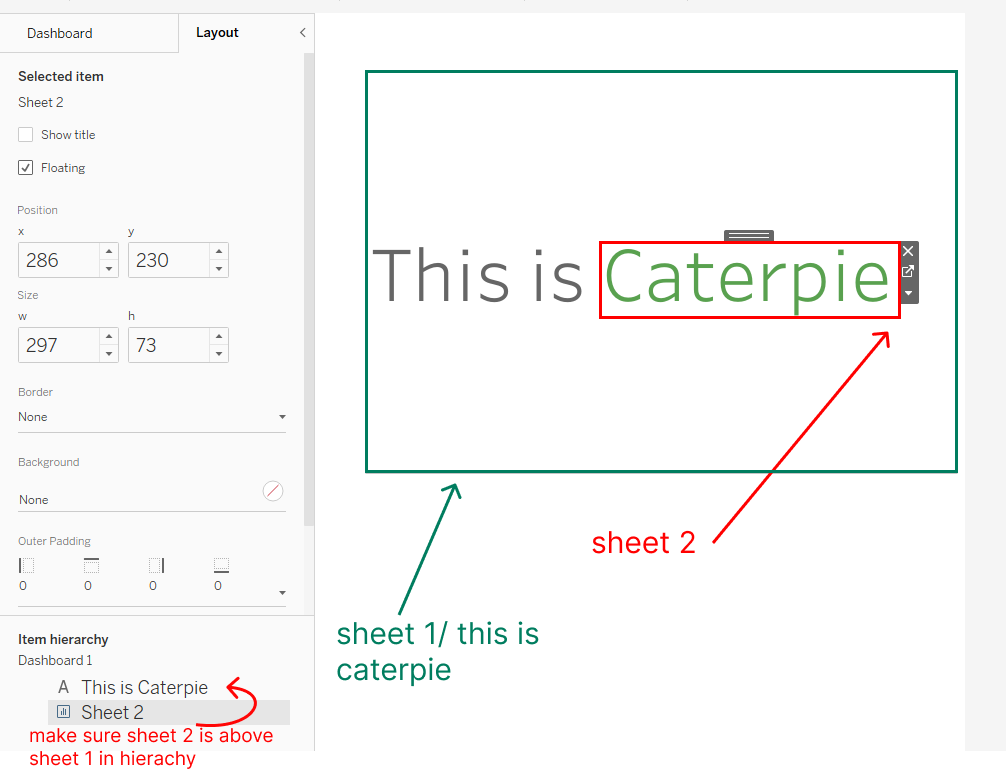
Step 7: Now go to your dashboard and take sheet 2. Float it over your dashboard, size it appropriately and place it where you want your tooltip. Also hide title. Make sure in your item hierarchy your tooltip is above your text or image that you want to display your tool tip.

Now hover over your tool tip :)

It may seem like a lot of steps but its actually really simple. You can get really creative with this tip. I attached one of my dashboards to show an example of what you can do with this tip!
https://public.tableau.com/app/profile/eric.l.williams/viz/Hisuianpokemon/dashboardhelp
