This week DS11 have been learning all about Servers – both the Tableau Server and the Alteryx Server, as well as their server repository databases. Performance of a server, its’ sites, projects and users, as well as details about logins, access and errors are all collected as metadata within these repository databases. The PostgreSQL database collects metadata about Tableau Server and the MongoDB database collects metadata about Alteryx Server.
Server metadata is highly useful for an organisation as it informs them which areas of their server are performing well and who’s getting the most, or no, use out of the various sites or pages. In an organisation where projects are being accessed many times a day, or in an organisation that has hundreds of licences, this information can be very valuable. For example, it identifies specific ‘pages’ that are very slow to render, and these can then be fixed to increase efficiency and therefore usability. It can also identify those that perhaps aren’t using the resources as often as they could, or those that are server champions accessing it regularly; driving value through the server.
Tableau PostgreSQL Server
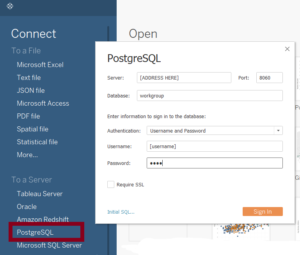
Part of this week, and this week’s Friday project, has focused on the Tableau PostgreSQL database. The default setting of the Tableau repository is that access is not allowed, so tabcmd, via the Command Prompt window, is used to unlock and download the data using port access 8060. We logged on as ‘readonly’ users, but you could also log on as ‘Tableau’ admin users. This database can be directly accessed and analysed within Tableau itself by connecting to the PostgreSQL server using the specific server machine login details.
PostgreSQL tables
Within the PostgreSQL database there are different types of tables and the amount of temporal data held varies across these:
- Tables starting with a “_” hold current data, e.g. _users is a list of current users and latest login times
- ‘hist_’/ ‘historical_’ tables hold data of every action over the last 183 days (~6 months) by default
- ‘http_’ tables hold any http request sent to the server over the last 7 days
- ‘background_’ tables hold about 30 days worth of data about processes that run in the background
- Other tables contain more specific information, e.g. about datasources or workbooks themselves
These tables then ‘join’ together in a number of ways, using a primary key or field. For a full data dictionary of the tables in the Tableau PostgreSQL database then see Tableau’s page here or Ravi’s Tableau Public breakdown of it, and the change with new Tableau versions, here.
For our project this week, we were tasked with looking into some aspect of The Information Lab’s Tableau Server using the PostgreSQL database. I focused on the historical tables because I was interested in exploring the frequency of logins to a server, to help identify:
- Are more people logging in, and if yes then is this happening more frequently? Does this leave a nice upward trend, or have server logins dropped off?
- When users do log in, is there a time when this happens most often? On a weekly or monthly basis?
- Who within the business are Tableau Server Power Users?
Because I focused on the historical data and the last 6 months activity, I needed a way to join all of the various historical tables together. Here I’ll show how the joins work for the historical data, and which primary keys work across the tables.
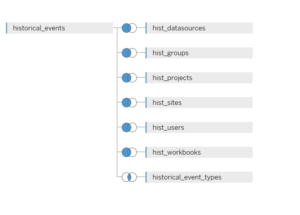
The PostgreSQL historical table Joins
How to join historical PostgreSQL tables
Start by dragging the table called ‘historical_events’ into the table area.
Then drag the table called ‘historical_event_types’ next to it, joining on ‘Historical Event Type Id’ and ‘Type Id’ – but note this is an inner join, where the others will be left joins. This join identifies every ‘event’, for example logging in, logging out or deleting workbooks, and gives it a user-friendly name.
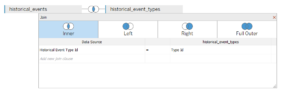
First PostgreSQL historical table join
Next up, join the rest of the relevant tables needed using a left join this time. Details on the joins are below:
- ‘hist_users’ : join using ‘Hist Actor User Id’ from ‘historical_events’ with ‘Id (Hist Users)’ from ‘hist_users’
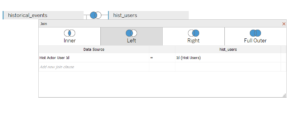
- ‘hist_groups’ : join using ‘Hist Group Id’ from ‘historical_events’ with ‘Id (Hist Groups)’ from ‘hist_groups’
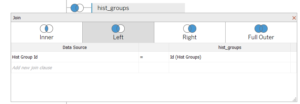
- ‘hist_sites’ : join using ‘Hist Actor Site Id’ from ‘historical_events’ with ‘Id (Hist Sites)’ from ‘hist_sites’

- ‘hist_projects’ : join using ‘Hist Project Id’ from ‘historical_events’ with ‘Id (Hist Projects)’ from ‘hist_projects’

- ‘hist_workbooks’ : join using ‘Hist Workbook Id’ from ‘historical_events’ with ‘Id (Hist Workbooks)’ from ‘hist_workbooks’

- ‘hist_datasources’ : join using ‘Hist Datasource Id’ from ‘historical_events’ with ‘Id (Hist Datasources)’ from ‘hist_datasources’

It’s fairly straight forward, once you know how the database is set up! It took a while to fully understand the server so hopefully the above steps help to lay it out for the first time you do the historical join. To know if the joins work, data will display when updated in the preview underneath; if it hasn’t worked – no data will show.
Now you can start exploring which users have logged on and when over the last few months, as well as identify who has accessed and interacted with workbooks, projects and sites across your server!
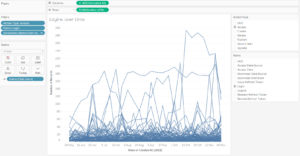
An output showing number of logins per user over the past 6 months
A really great things is that Tableau Server’s PostgreSQL database is the same schema (structure) for each server. This means that if you keep the field names the same (and Tableau doesn’t change or update the table structure anytime soon) you can switch the PostgreSQL details that Tableau Desktop is looking at, and the rest of the worksheets and dashboards will update with that specific server information! Magic!
