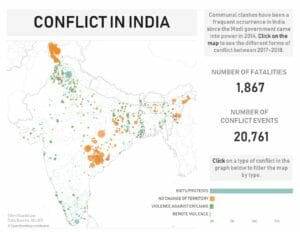
This week, Makeover Monday centred around a data set from ACLED which detailed conflict events around the world. Owed to the wealth of data that could be seen spanning across the countries, the various events became difficult to visualise and explore, so I decided to focus on a single country. I chose India because the number of events and vast number of riots in this area were immediately apparent, and I hadn’t seen anyone take this perspective.
After about an hour and a half, my viz looked like this:

Following a group discussion about our individual attempts, I had some feedback about what should be improved.
- Completely remove the base of the map to strengthen my chosen theme.
- Remove the list of conflict types and find a way to use data to allow this navigation.
After implementing these improvements, I feel the theme of my viz looks a lot more cohesive and the bar chart makes a much more interesting addition than the conflict categories.

Click here to see my viz.
