My first task as a DSer was preparing a 10-minute presentation on a chosen subject we learned during the week. My topic was “Cleansing and organizing data using the profiling pane in Tableau Prep”. We also received some presentation points to talk about: explain the purpose of the topic and how it helps work with data, explain and demonstrate the tools/ functions used.
Why do we need Tableau Prep?
When working with a fresh set of data, it is rarely perfectly ready for visualization. One of the first things a data analyst would likely do is clean, explore, and prepare the data. For this, Tableau Prep is a visual data preparation tool that makes it simple to quickly clean up, reshape, and prepare data so you can start working with it right away.
What does Tableau Prep look like?
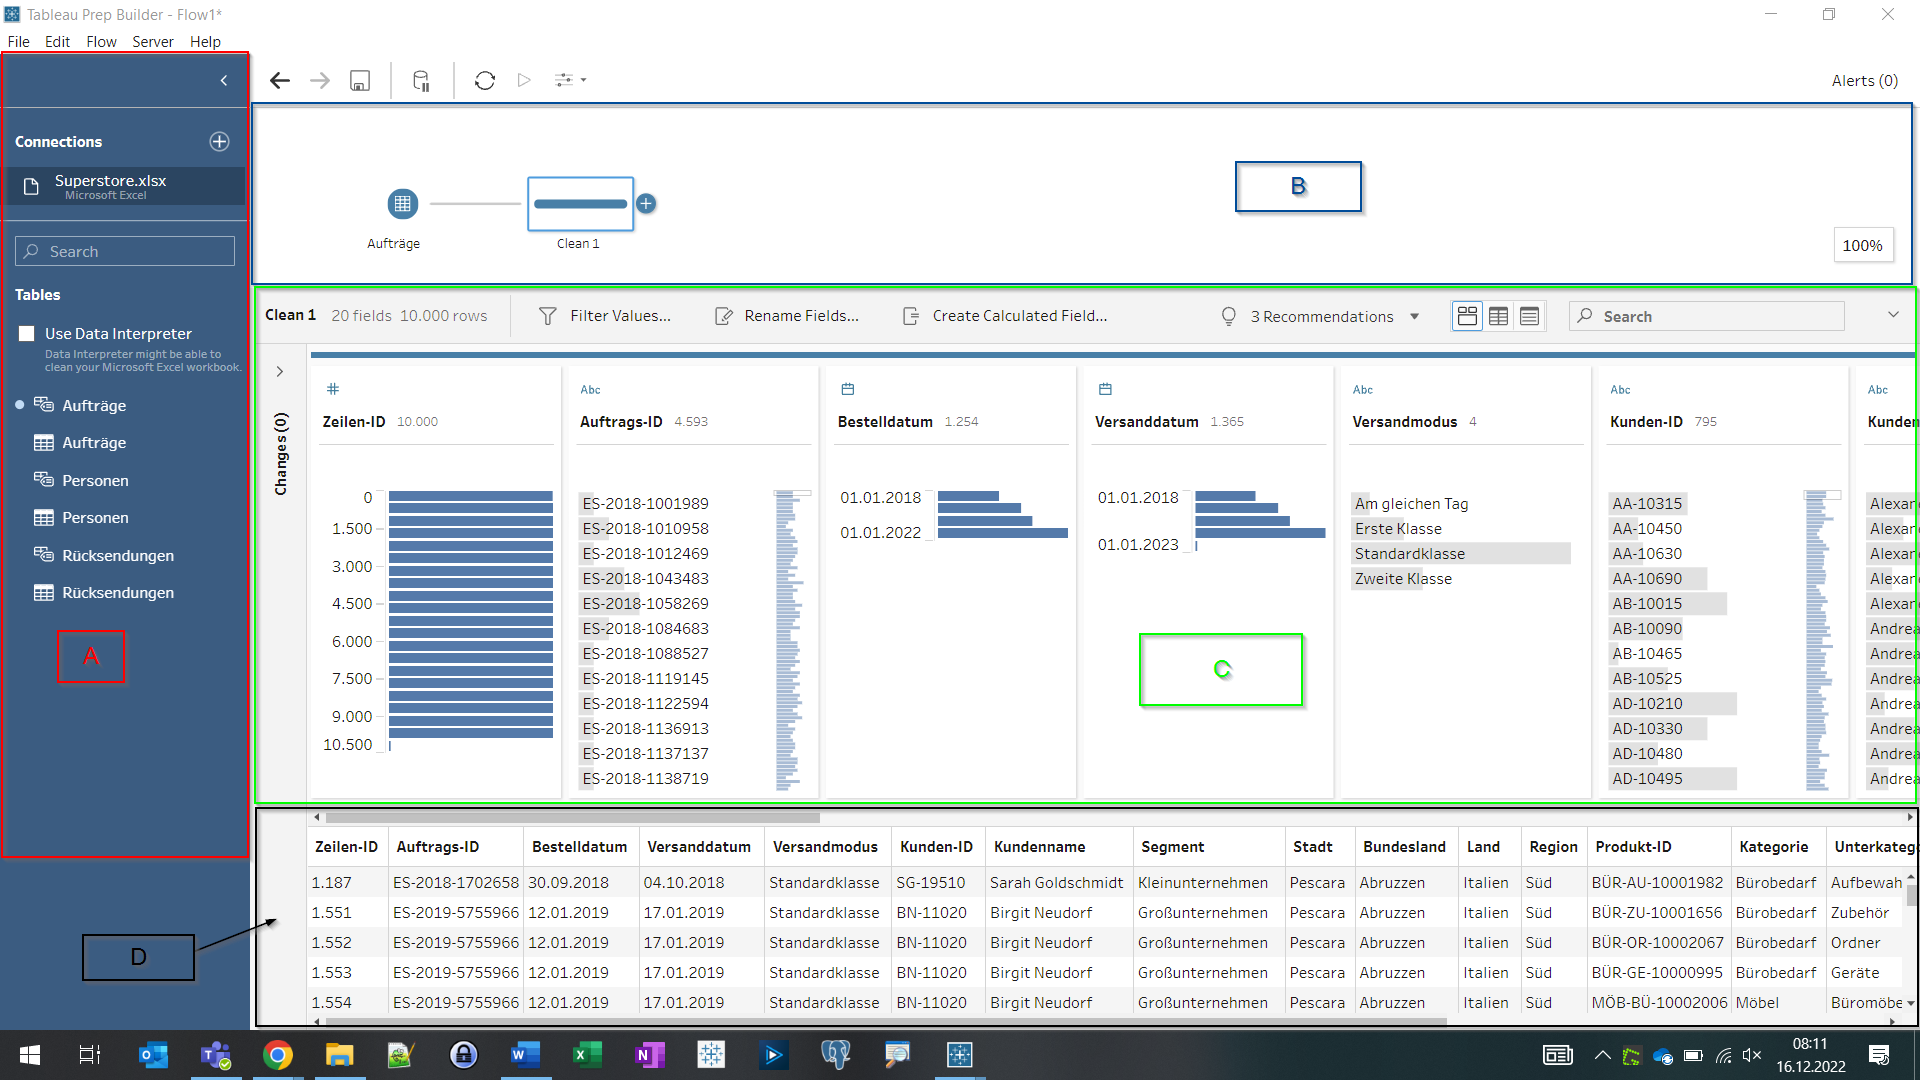
Tableau Prep’s interface looks quite simple and intuitive once you get used to it. The workspace consists of the following (see the photo attached):
· Your connection to your data sources is made in the Connections pane (A).
· Flow pane (B): used to prepare your data, you can see a visual representation of your operation steps. This is where you will add steps to your flow.
· Profile pane (C): provides a description of each field in your data sample. Here you can see more information about your data (number of rows and fields) and quickly find outliers and null values.
· Data grid (D): your data’s row level detail
Using the profile pane in Tableau Prep
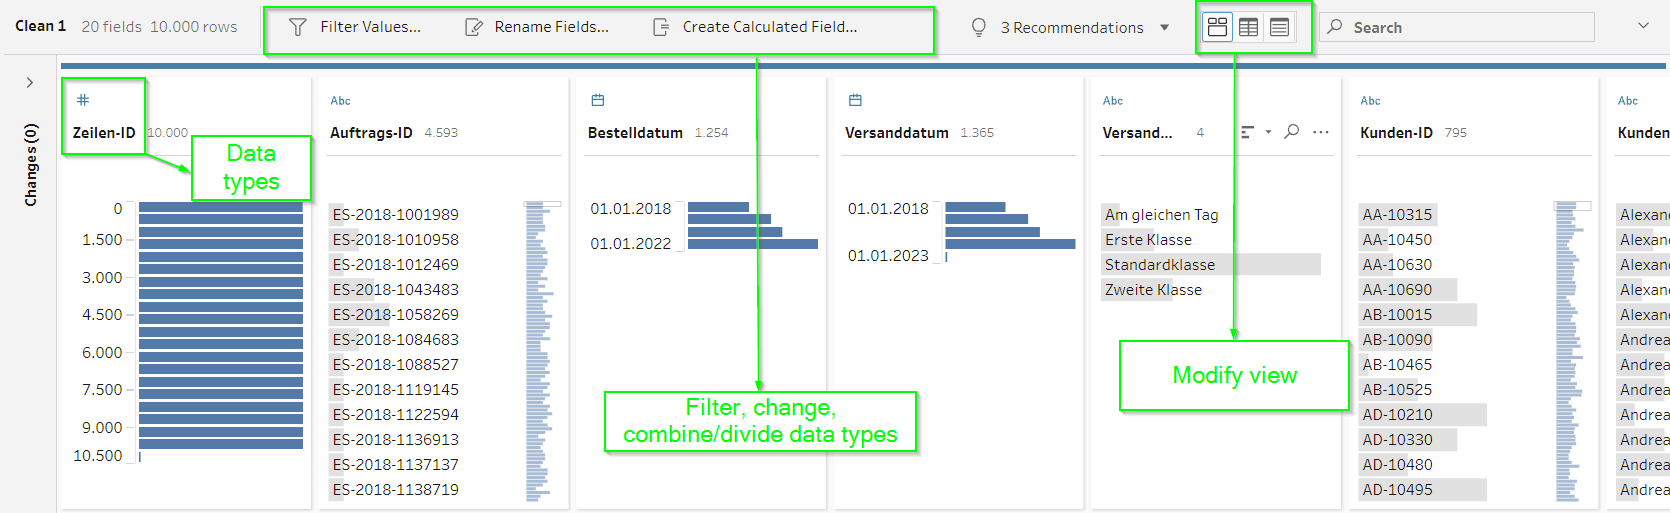
The profile pane provides a quick summary of each field in your data sample and allows you to do the following things (see the photo attached):
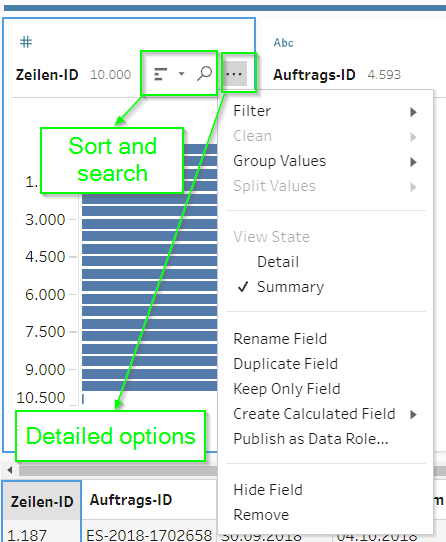
o Modify field names and data types
o Search and sort data
o Filter, include, or exclude values
o Combine values
o Divide fields
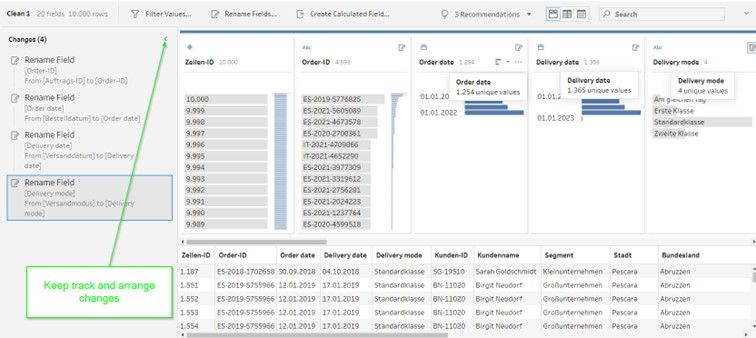
You can always go back and review or adjust changes if necessary because Tableau Prep records all of your changes in the order that you make them. To experiment and apply changes in a different order, use drag and drop to reorder the listed operations.