For Makeover Monday week 3, I wanted to play around with the tiled map options. I knew how to make hex maps but I also liked the donut charts so I thought why not combine them?
But first what are tiled maps used for? Tiled maps are used to display features using geometry rather than geography. This gives them far more flexibility when it comes to fitting everything on one screen and maintaining a consistent emphasis.
So let’s get started. First I will connect the data (you can download it from here). To start building the tile map, I need to create two calculated fields that will give the position of the tiles on the x- and y-axis. Since the dataset contains data for Canadian territories, I will also include these territories in my calculations.
The Row calculation entails:
CASE [State Or Province]
WHEN 'Alabama' THEN -6
WHEN 'Alaska' THEN -0
WHEN 'American Samoa' THEN -8
WHEN 'Arizona' THEN -5
WHEN 'Arkansas' THEN -5
WHEN 'California' THEN -5
WHEN 'Colorado' THEN -5
WHEN 'Connecticut' THEN -3
WHEN 'Delaware' THEN -4
WHEN 'District of Columbia' THEN -4
WHEN 'Florida' THEN -8
WHEN 'Georgia' THEN -7
WHEN 'Guam' THEN -7
WHEN 'Hawaii' THEN -8
WHEN 'Idaho' THEN -3
WHEN 'Illinois' THEN -3
WHEN 'Indiana' THEN -3
WHEN 'Iowa' THEN -3
WHEN 'Kansas' THEN -5
WHEN 'Kentucky' THEN -4
WHEN 'Louisiana' THEN -6
WHEN 'Maine' THEN -1
WHEN 'Maryland' THEN -4
WHEN 'Massachusetts' THEN -2
WHEN 'Michigan' THEN -2
WHEN 'Minnesota' THEN -2
WHEN 'Mississippi' THEN -6
WHEN 'Missouri' THEN -4
WHEN 'Montana' THEN -2
WHEN 'Nebraska' THEN -4
WHEN 'Nevada' THEN -4
WHEN 'New Hampshire' THEN -1
WHEN 'New Jersey' THEN -3
WHEN 'New Mexico' THEN -6
WHEN 'New York' THEN -2
WHEN 'North Carolina' THEN -5
WHEN 'North Dakota' THEN -2
WHEN 'Ohio' THEN -3
WHEN 'Oklahoma' THEN -6
WHEN 'Oregon' THEN -4
WHEN 'Pennsylvania' THEN -3
WHEN 'Puerto Rico' THEN -8
WHEN 'Rhode Island' THEN -2
WHEN 'South Carolina' THEN -6
WHEN 'South Dakota' THEN -3
WHEN 'Tennessee' THEN -5
WHEN 'Texas' THEN -7
WHEN 'Utah' THEN -4
WHEN 'Vermont' THEN -1
WHEN 'Virginia' THEN -5
WHEN 'Washington' THEN -2
WHEN 'West Virginia' THEN -4
WHEN 'Wisconsin' THEN -2
WHEN 'Wyoming' THEN -3
WHEN 'Yukon' THEN -0
WHEN 'Northwest Territories' THEN -0
WHEN 'Nanavut' THEN -0
WHEN 'Newfoundland & Labrador' THEN -0
WHEN 'British Columbia' THEN -1
WHEN 'Alberta' THEN -1
WHEN 'Saskatchewan' THEN -1
WHEN 'Manitoba' THEN -1
WHEN 'Ontario' THEN -1
WHEN 'Prince Edward Island' THEN -0
WHEN 'Quebec' THEN -1
WHEN 'New Brunswick' THEN -0
WHEN 'Nova Scotia' THEN -0
WHEN 'Unknown' THEN -6.5
END
The Column calculation:
CASE [State Or Province]
WHEN 'Alabama' THEN 7.5
WHEN 'Alaska' THEN 0.5
WHEN 'American Samoa' THEN .5
WHEN 'Arizona' THEN 3
WHEN 'Arkansas' THEN 6
WHEN 'California' THEN 2
WHEN 'Colorado' THEN 4
WHEN 'Connecticut' THEN 11
WHEN 'Delaware' THEN 10.5
WHEN 'District of Columbia' THEN 8.5
WHEN 'Florida' THEN 8.5
WHEN 'Georgia' THEN 8
WHEN 'Guam' THEN 1
WHEN 'Hawaii' THEN 1.5
WHEN 'Idaho' THEN 2
WHEN 'Illinois' THEN 6
WHEN 'Indiana' THEN 7
WHEN 'Iowa' THEN 5
WHEN 'Kansas' THEN 5
WHEN 'Kentucky' THEN 6.5
WHEN 'Louisiana' THEN 5.5
WHEN 'Maine' THEN 12
WHEN 'Maryland' THEN 9.5
WHEN 'Massachusetts' THEN 10.5
WHEN 'Michigan' THEN 7.5
WHEN 'Minnesota' THEN 4.5
WHEN 'Mississippi' THEN 6.5
WHEN 'Missouri' THEN 5.5
WHEN 'Montana' THEN 2.5
WHEN 'Nebraska' THEN 4.5
WHEN 'Nevada' THEN 2.5
WHEN 'New Hampshire' THEN 11
WHEN 'New Jersey' THEN 10
WHEN 'New Mexico' THEN 3.5
WHEN 'New York' THEN 9.5
WHEN 'North Carolina' THEN 9
WHEN 'North Dakota' THEN 3.5
WHEN 'Ohio' THEN 8
WHEN 'Oklahoma' THEN 4.5
WHEN 'Oregon' THEN 1.5
WHEN 'Pennsylvania' THEN 9
WHEN 'Puerto Rico' THEN 11
WHEN 'Rhode Island' THEN 11.5
WHEN 'South Carolina' THEN 8.5
WHEN 'South Dakota' THEN 4
WHEN 'Tennessee' THEN 7
WHEN 'Texas' THEN 4
WHEN 'Utah' THEN 3.5
WHEN 'Vermont' THEN 10
WHEN 'Virginia' THEN 8
WHEN 'Washington' THEN 1.5
WHEN 'West Virginia' THEN 7.5
WHEN 'Wisconsin' THEN 5.5
WHEN 'Wyoming' THEN 3
WHEN 'Yukon' THEN 1.5
WHEN 'Northwest Territories' THEN 2.5
WHEN 'Nanavut' THEN 3.5
WHEN 'Newfoundland & Labrador' THEN 9.5
WHEN 'British Columbia' THEN 2
WHEN 'Alberta' THEN 3
WHEN 'Saskatchewan' THEN 4
WHEN 'Manitoba' THEN 5
WHEN 'Ontario' THEN 7
WHEN 'Prince Edward Island' THEN 11.5
WHEN 'Quebec' THEN 9
WHEN 'New Brunswick' THEN 10.5
WHEN 'Nova Scotia' THEN 12.5
WHEN 'Unknown' THEN 12
END
If we want to show the abbreviation of the state name (because the full state name will make the map look cramped), we can create the following calculation for the State abbreviation label:
CASE [State Or Province]
WHEN 'Alabama' THEN 'AL'
WHEN 'Alaska' THEN 'AK'
WHEN 'Arizona' THEN 'AZ'
WHEN 'Arkansas' THEN 'AR'
WHEN 'American Samoa' THEN 'AS'
WHEN 'California' THEN 'CA'
WHEN 'Colorado' THEN 'CO'
WHEN 'Connecticut' THEN 'CT'
WHEN 'Delaware' THEN 'DE'
WHEN 'District of Columbia' THEN 'DC'
WHEN 'Florida' THEN 'FL'
WHEN 'Georgia' THEN 'GA'
WHEN 'Guam' THEN 'GU'
WHEN 'Hawaii' THEN 'HI'
WHEN 'Idaho' THEN 'ID'
WHEN 'Illinois' THEN 'IL'
WHEN 'Indiana' THEN 'IN'
WHEN 'Iowa' THEN 'IA'
WHEN 'Kansas' THEN 'KS'
WHEN 'Kentucky' THEN 'KY'
WHEN 'Louisiana' THEN 'LA'
WHEN 'Maine' THEN 'ME'
WHEN 'Maryland' THEN 'MD'
WHEN 'Massachusetts' THEN 'MA'
WHEN 'Michigan' THEN 'MI'
WHEN 'Minnesota' THEN 'MN'
WHEN 'Mississippi' THEN 'MS'
WHEN 'Missouri' THEN 'MO'
WHEN 'Montana' THEN 'MT'
WHEN 'Nebraska' THEN 'NE'
WHEN 'Nevada' THEN 'NV'
WHEN 'New Hampshire' THEN 'NH'
WHEN 'New Jersey' THEN 'NJ'
WHEN 'New Mexico' THEN 'NM'
WHEN 'New York' THEN 'NY'
WHEN 'North Carolina' THEN 'NC'
WHEN 'North Dakota' THEN 'ND'
WHEN 'Ohio' THEN 'OH'
WHEN 'Oklahoma' THEN 'OK'
WHEN 'Oregon' THEN 'OR'
WHEN 'Pennsylvania' THEN 'PA'
WHEN 'Puerto Rico' THEN 'PR'
WHEN 'Rhode Island' THEN 'RI'
WHEN 'South Carolina' THEN 'SC'
WHEN 'South Dakota' THEN 'SD'
WHEN 'Tennessee' THEN 'TN'
WHEN 'Texas' THEN 'TX'
WHEN 'Utah' THEN 'UT'
WHEN 'Vermont' THEN 'VT'
WHEN 'Virginia' THEN 'VA'
WHEN 'Washington' THEN 'WA'
WHEN 'West Virginia' THEN 'WV'
WHEN 'Wisconsin' THEN 'WI'
WHEN 'Wyoming' THEN 'WY'
WHEN 'Yukon' THEN 'YT'
WHEN 'Northwest Territories' THEN 'NT'
WHEN 'Nanavut' THEN 'NU'
WHEN 'Newfoundland & Labrador' THEN 'NL'
WHEN 'British Columbia' THEN 'BC'
WHEN 'Alberta' THEN 'AB'
WHEN 'Saskatchewan' THEN 'SK'
WHEN 'Manitoba' THEN 'MB'
WHEN 'Ontario' THEN 'ON'
WHEN 'Quebec' THEN 'QC'
WHEN 'New Brunswick' THEN 'NB'
WHEN 'Nova Scotia' THEN 'NS'
WHEN 'Prince Edward Island' THEN 'PEI'
WHEN 'Unknown' THEN 'Unkn.'
END
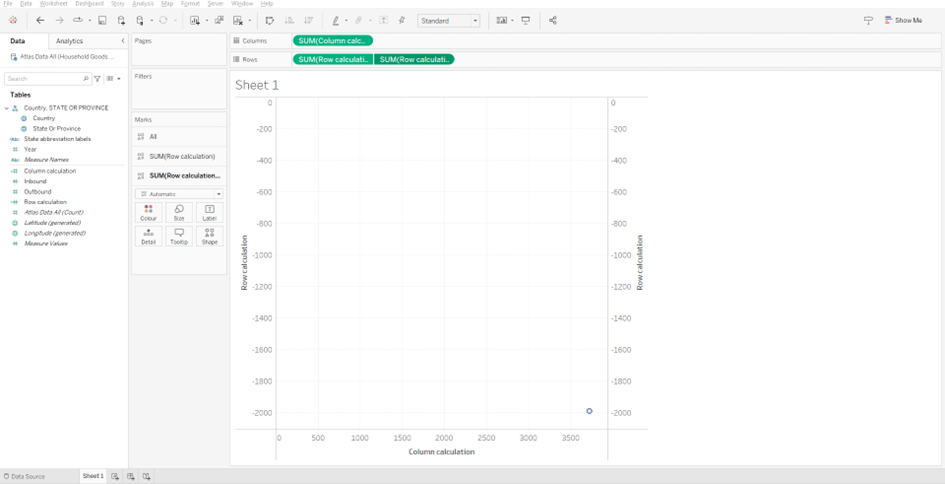
Now that we have all the calculations needed, we can start by dragging the Column calculation and Row calculation to the Columns and Rows shelves respectively. Now keep in mind that we want a donut tile map. For this, we need to duplicate the Row calculation in the Rows shelf by holding Ctrl and dragging it to the right. We now need to click right on the second Row calculation and choose Dual Axis. This is what our view looks like so far, not so cool right?
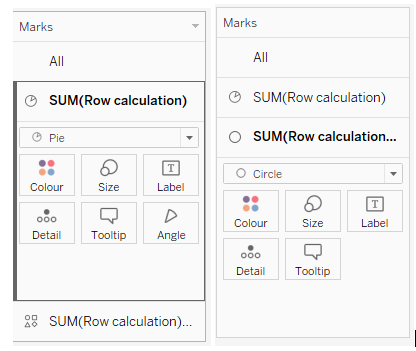
We will synchronize the axis by right-clicking on the left Row calculation axis and choosing Synchronise axis. We see just one circle but on the left side, in the Marks card, we see we have two marks. For the first mark, we need to choose the Pie option, and for the second one, we will choose the Circle type.
Now we need to add our Measure Values from the Data pane to the Angle of the first marks card. Since we only need the inbound and outbound data, we will take out the other measures by dragging them out of the Measure Values card. We don’t need the Measure Names in the Detail so we will change it to Colour and add the State abbreviation labels to the Label. In the second card (the Circle), we see we still have the Measure Names in the Detail. We can take the pill out by dragging it outside the card and adding the State abbreviation labels to the Label.
The map is starting to look much better. We just need to do some formatting and we’re almost done. In the Circle card, change the color of the circle to white, make the size of the circle bigger, and from Label change the Alignment to Middle Centre. In the Pie card, also make the size of the pie much bigger. From the Label, unclick Show mark labels. Let’s also hide our axis since we don’t need them. We can do that by right-clicking on the respective axis and deselecting Show Header. We also don’t want to see all the gridlines, so we will click right on the canvas and select Format. From the Lines section, we will choose None for Borderlines and Zero in the Sheet.
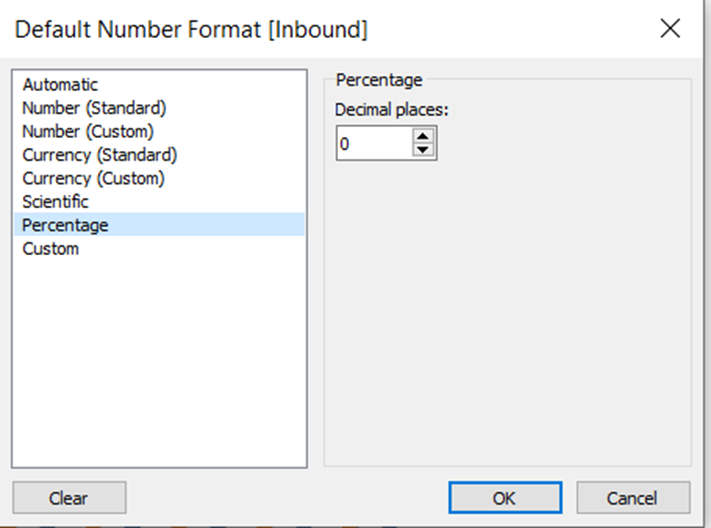
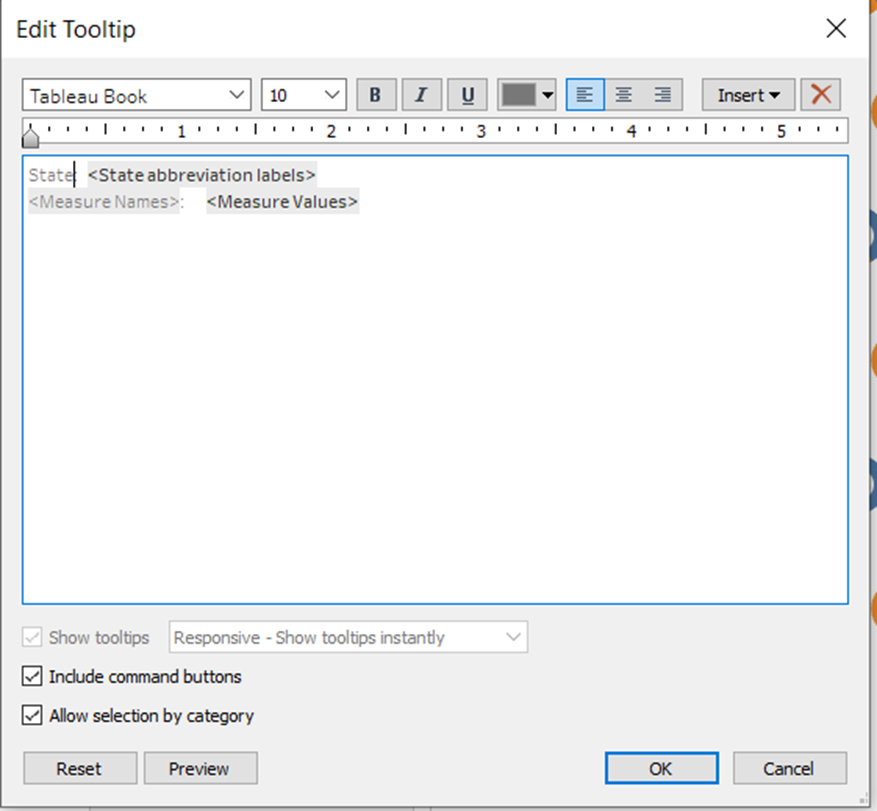
The only thing left to do is to set some filters as we can see that the Inbound and Outbound values are all summed up. So let’s add the Year to the Filters card but before we do that, we first need to change the Year to discrete values by right-clicking and choosing Convert to Discrete. Now when we add the Year to the Filters card, we can choose for which year we want our donut tile map to show the values. Let’s choose the most current year: 2022. We still need to do some formatting because now our Inbound and Outbound values are not showing percentages. For this, we need to right-click on the Inbound and choose Default Properties -> Number Format. We will choose Percentage with 0 decimal places. Repeat the same step for Outbound. We also need to adjust our tooltip so it won’t show the Row and Column calculations that we did before.