Tableau is a business intelligence and data visualization software that offers a wide range of development tools and APIs for integrating, customizing, automating, and extending Tableau features for the needs of specific organizations. A useful visual to show the frequency of words in a given quantity of text is the word cloud, which groups together the most significant or distinctive terms found in the dataset.
After connecting to the Sample Superstore date, go to a new worksheet. In this blog post, I will create a word cloud that shows each State sized by Sales and colored by profit.
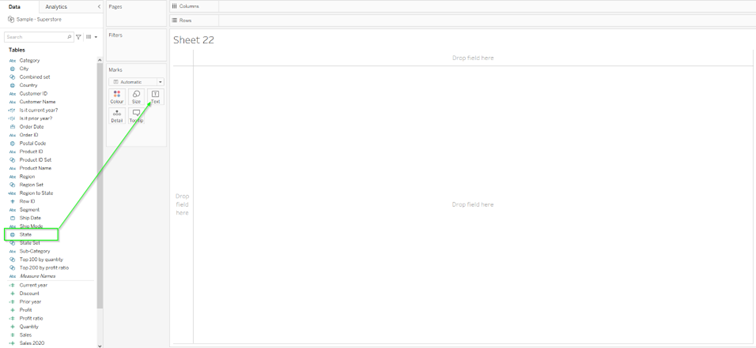
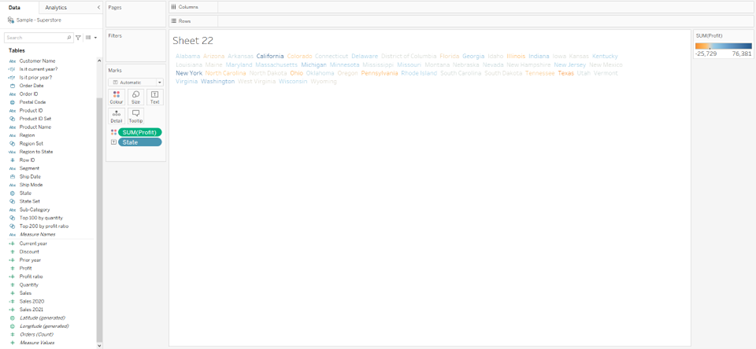
First, drag the State dimension to the Text marks card.
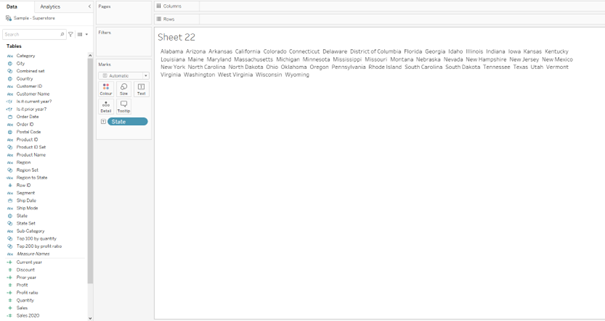
This will generate a list of all the states in the dataset in alphabetical order.
Now we need to add the Profit measure to the Colour marks card.
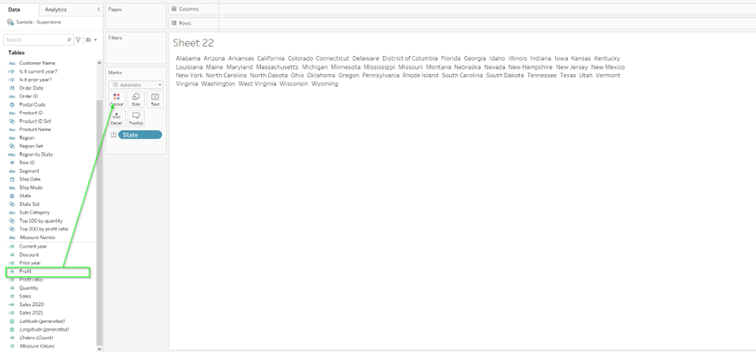
This will color the name of the states based on the profit each state has made.
The next step is to add the Sales measure to the Size marks card.
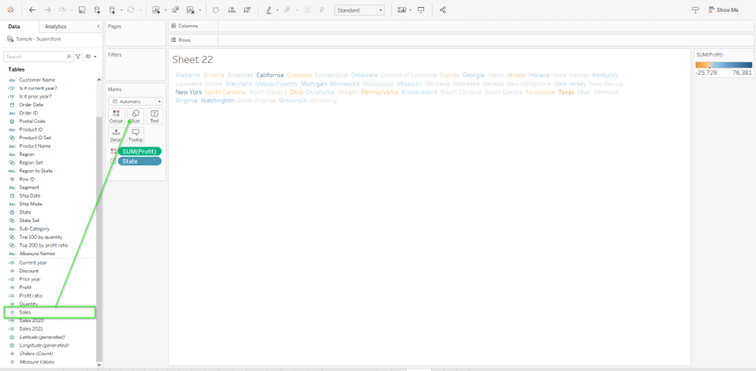
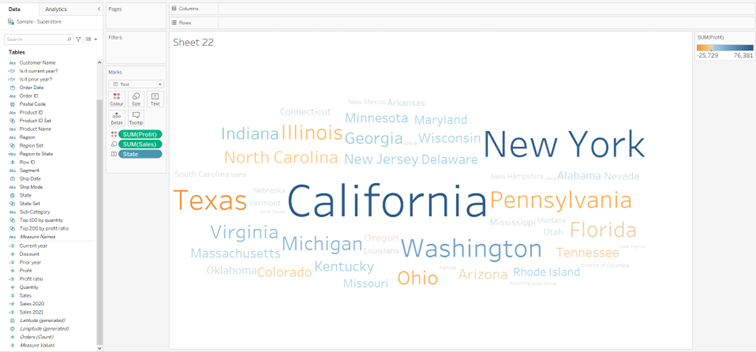
Tableau will try to automatically find a table suitable for this type of data, which in our case is not what we really wanted. To change the type of the table, choose Text as the table type from the marks card. In the end, we get the word cloud, which shows California in the middle with the highest profit and sales amount. And that's it!