What exactly is Tableau Next?
Tableau Next is the world's first agentic analytics platform. It uses. It connects all your data in one trusted place, helping everyone on your team spot trends, make predictions, and take action without the usual guesswork.
One thing helpful feature that I learnt is not available in Tableau Desktop is Metrics. Instead of having to hunt through messy charts, a metric isolates the one most important number you need to know - like total sales or profit ratio.
How to Create a Metric in Tableau Next
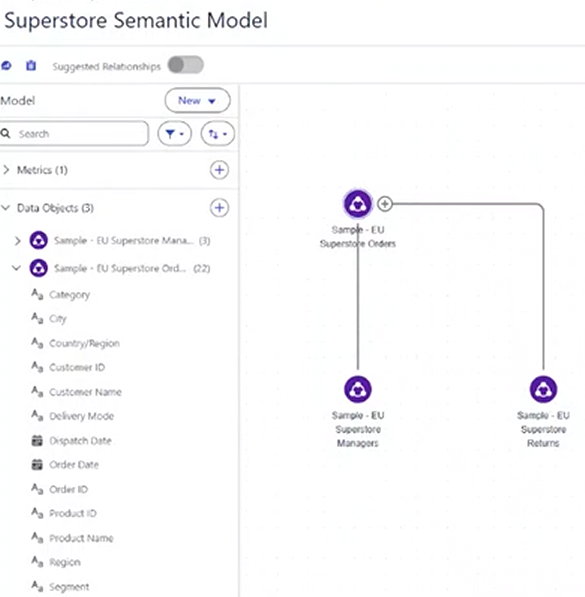
To create a metric, you must be working within a semantic model. Once you are in your model, you will see a button that says "Edit" in the top right corner.
Once you have pressed the edit button, a button dropdown called "New" will appear in the "model" pane on the left.
Select "Metric".
This pop up will then appear:
Detail Pane:
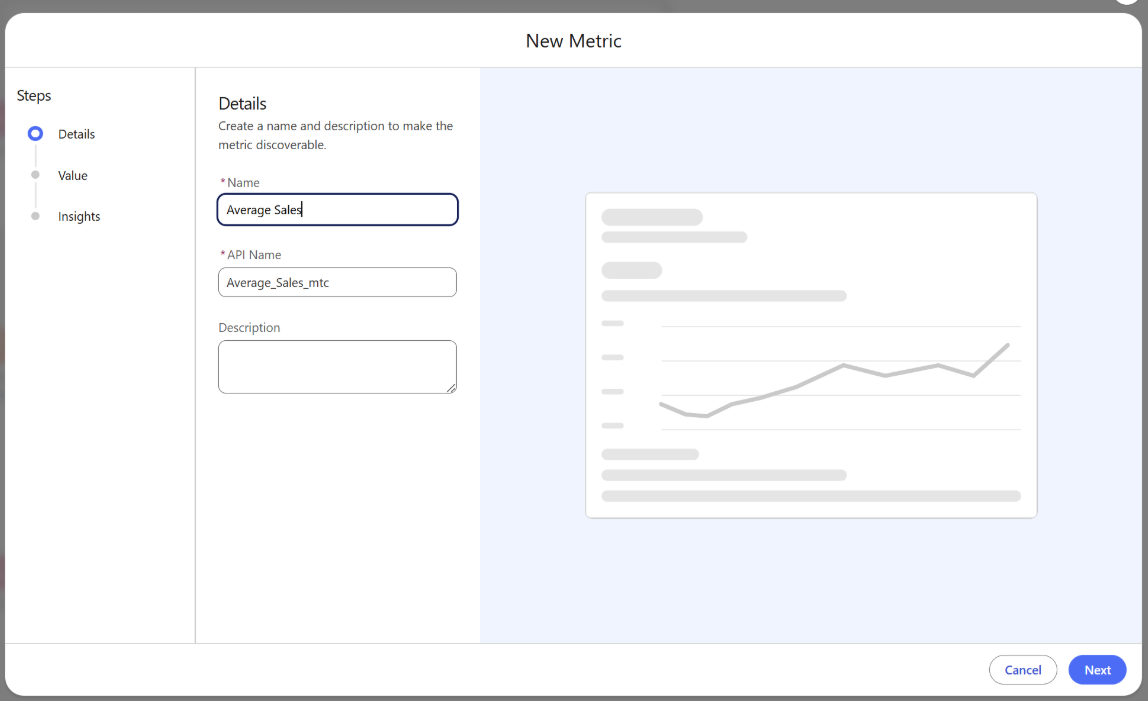
This is where you are able to name your metric and describe it.
Value Pane:
Once you click Next you will be taken to the Value pane
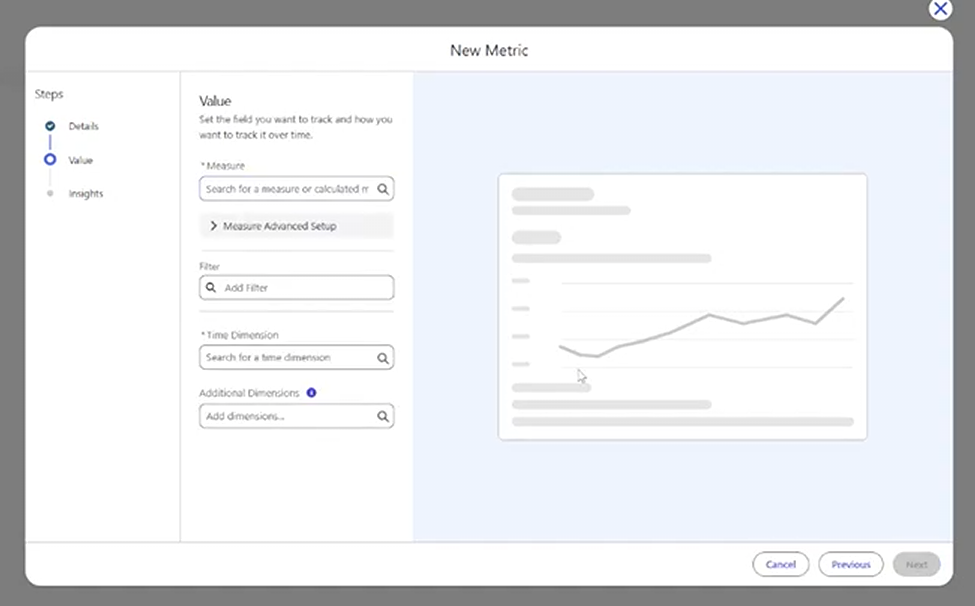
This is where you can decide what measure your metric will track.
If you click the 'Measure Advanced Setup' toggle you will be shown the following options
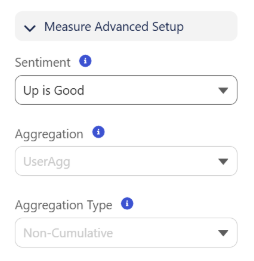
You are able to set the sentiment, aggregation and aggregation type.
- Sentiment - define if an upward trend is good, bad or neutral.
- Aggregation - choose the aggregation method to be applied to your measure - e.g. Sum, Avg, Min, Max etc.
- Aggregation Type - choose between non-cumulative and cumulative in how your data is summarised over time.
You then need to add a time dimension as every metric requires one.
The additional dimensions options gives you the option which allows you to query the metric by.
Two things to note:
- Think about the amount of dimensions you are adding here. The amount of processing credits used multiplies based on the number of dimensions (and the values within them) that you include. Stick to the ones most relevant to your metric to avoid unnecessary costs.
- When you start building dashboards in Tableau Next, you can filter things like you can Power BI (clicking a dimension on one chart to filter the rest). But here’s a quick heads-up: if you click a dimension that you didn't add as an "additional dimension" when creating your Metric, the Metric won't update. Definitely something to keep in mind!
Insight Pane:
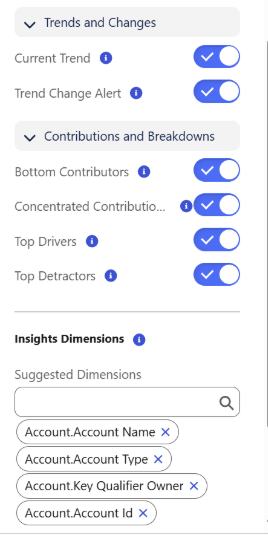
You can specify:
Trends and changes
- Show the current trend (highlighting the direction, rate of change, and fluctuations) and automatically identify new trends that differ significantly from past data.
Contributions & breakdowns
- Easily pinpoint the bottom contributors (lowest values) in a dimension, highlight areas with a high concentration of top values, or call out your top drivers and detractors (the values that increased or decreased the most over a specific timeframe).
Finally, use the second part of the Insight Pane to specify which dimensions you want Tableau Next to evaluate for these automated insights. (Note: If you didn't add any additional dimensions back in the Value Pane, this section won't be available).
Then you will have created a new metric!
It will be located at the top of the side pane in your semantic model.