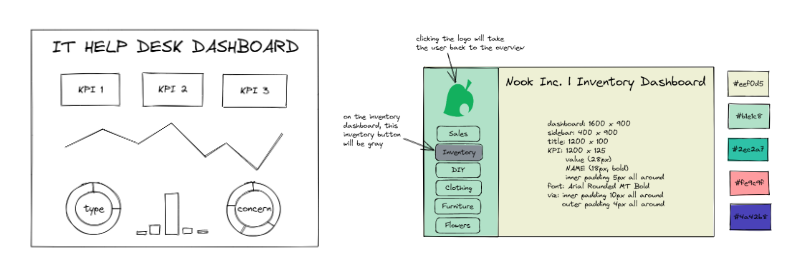
Excalidraw is an amazing tool for visualizing dashboards. It is essentially an online whiteboard, where people can collaboratively design diagrams with a hand-drawn look and feel.
When Head Coach Ann Jackson shared the following data visualization, I thought she drew the diagram, but to my surprise, it was Excalidraw!
Immediately, I visited the site and noticed the toolbar across the top of the canvas. These tools are simple and for this reason, they can be conveniently used in various ways.
Can you determine what tools I used for these dashboard mockups?

Moreover, Excalidraw has been instrumental in our weekly client projects. As you can see below, you can effortlessly collaborate with others live by sharing a link.
In last week’s client project, we used Excalidraw extensively to brainstorm and share our dashboard design ideas. If you’re curious, here are our helpful scribbles:
We are likely to continue to use Excalidraw in future client projects and dashboard work. It’s incredibly helpful to sketch your ideas down somewhere and with Excalidraw, you can easily do so with your colleagues! Therefore, I recommend you to:
