


Since seeing Ann Jackson’s resume on her Tableau Public, I wanted to make my own; this was before my Data School training and now that I’m done with training, I feel well-equipped to design one.
Before opening Tableau, I browsed the interactive resume gallery for inspiration. I was also impressed by the interactive resumes of Data Schoolers from Down Under, including Thao Tran’s and Andrew Ho's. After reviewing what others have done, I was ready to start!
First, I mocked up my dashboard. I included essential resume sections, like contact information, summary, work experience, and skills. I also wanted to illustrate my work abroad with a map, feature some of my favorite Tableau work, and showcase my interests outside of data visualization.

After establishing the sections of my dashboard, I prepared my data in Google Sheets. I created worksheets for each of my sections, education, work experience, certifications, etc. I downloaded the workbook to bring into Tableau and continued to adjust it based on my data visualization needs. For example, I initially separated education and work experience in two worksheets or tables, but by bringing them together in one, I can easily visualize the two in the same Gantt chart.
My data ultimately looked like this:

In order to list the various responsibilities of a role, I structured my data so that each row represented a role and one of its responsibilities. I also added an ID column to help differentiate between roles.

I wanted to link my Goodreads profile for users to get a better understanding of my reading preferences and habits.

I found a proficiency rubric to help me rate my various skills and planned to include the lookup table below as the tooltip of an information icon. 🛈


I ultimately decided to keep my certificates separate from my education and employment to allow users to click on them for further details.

Although I included image URLS to play with image roles in Tableau, I found them to be less flexible than custom shapes.
Finally, here is my interactive resume:
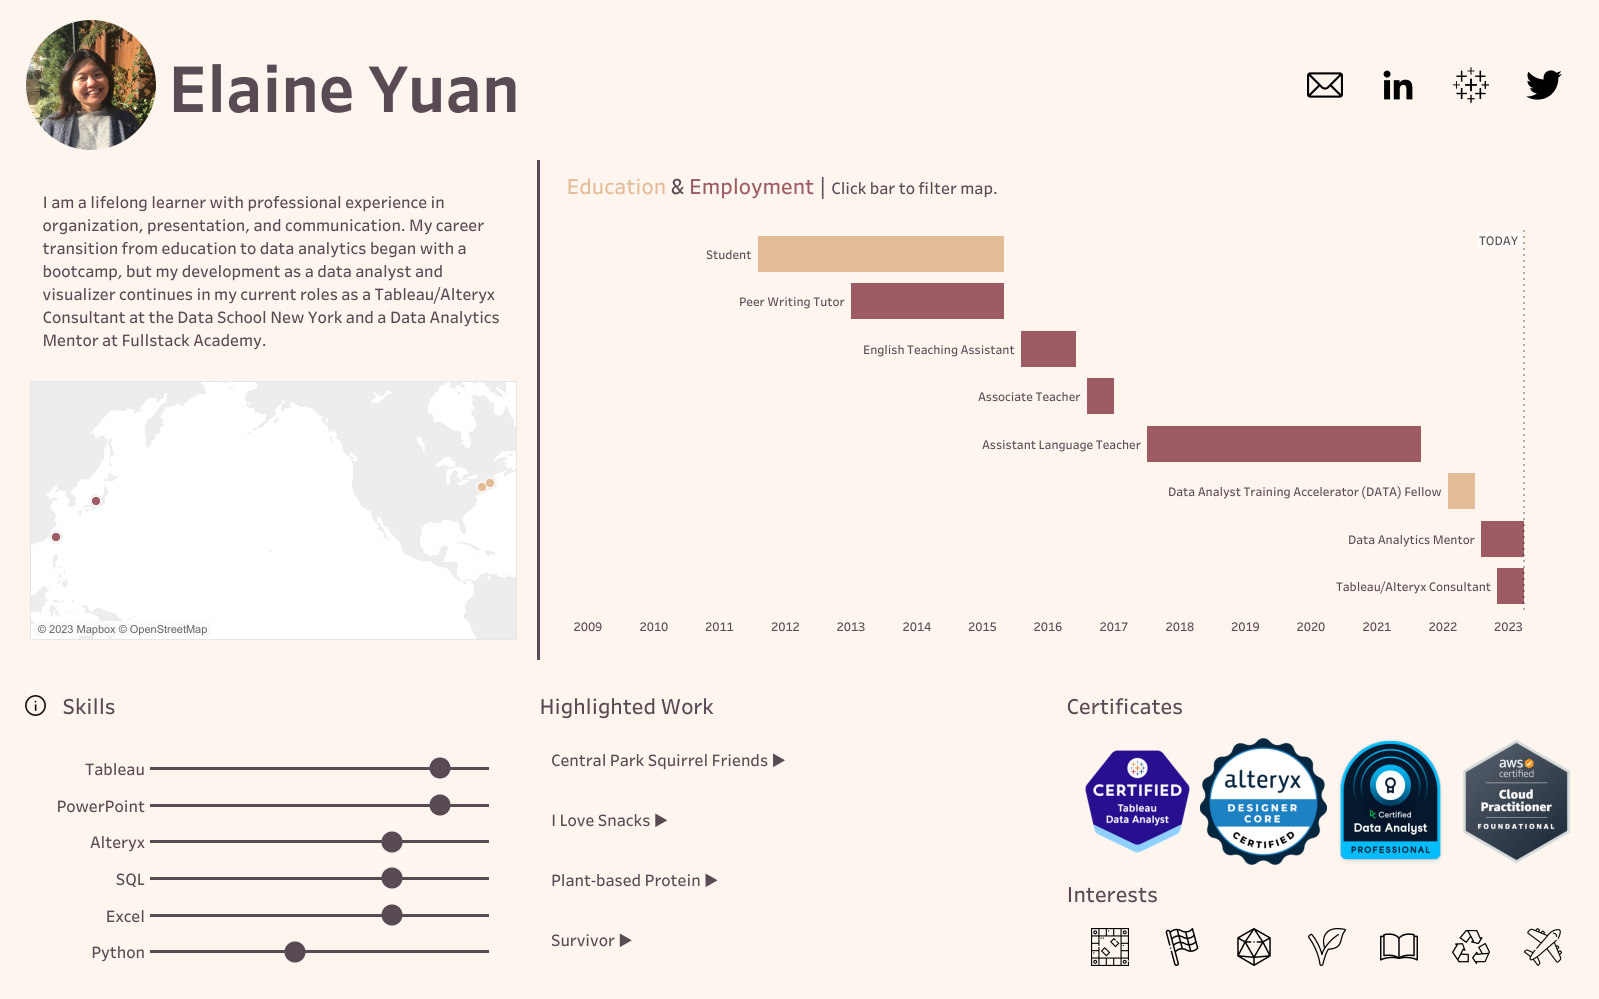
There will likely be multiple iterations of this dashboard. I know I want to add one or two more works in the highlighted work section. Additionally, I know I will earn additional certificates that may be added to the current roster. However, for now, I am satisfied with the simplicity of my interactive resume. This was a fun exercise that I recommend any Tableau user to try!