


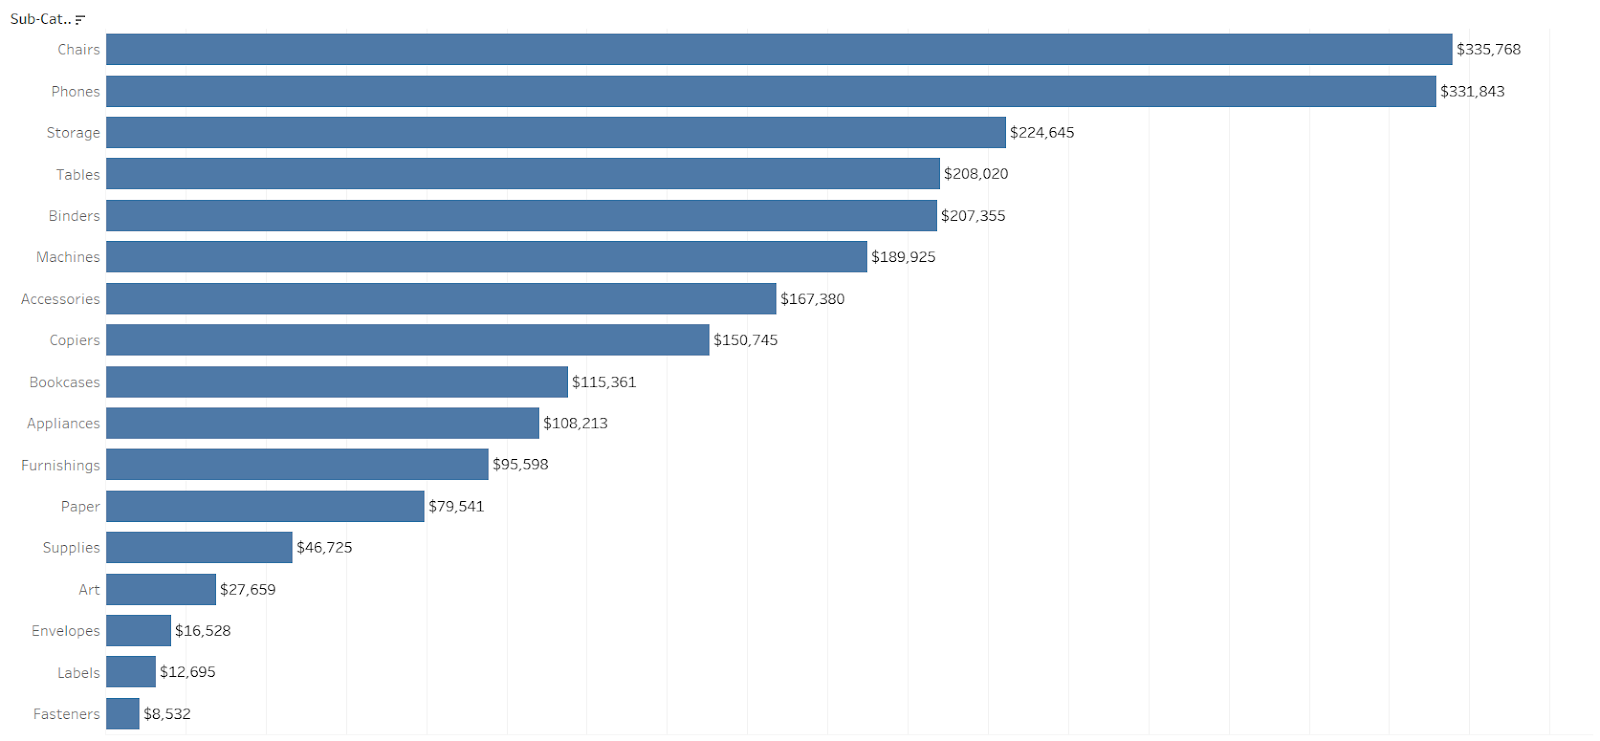
I have seen a lot of bar charts that look similar to this:
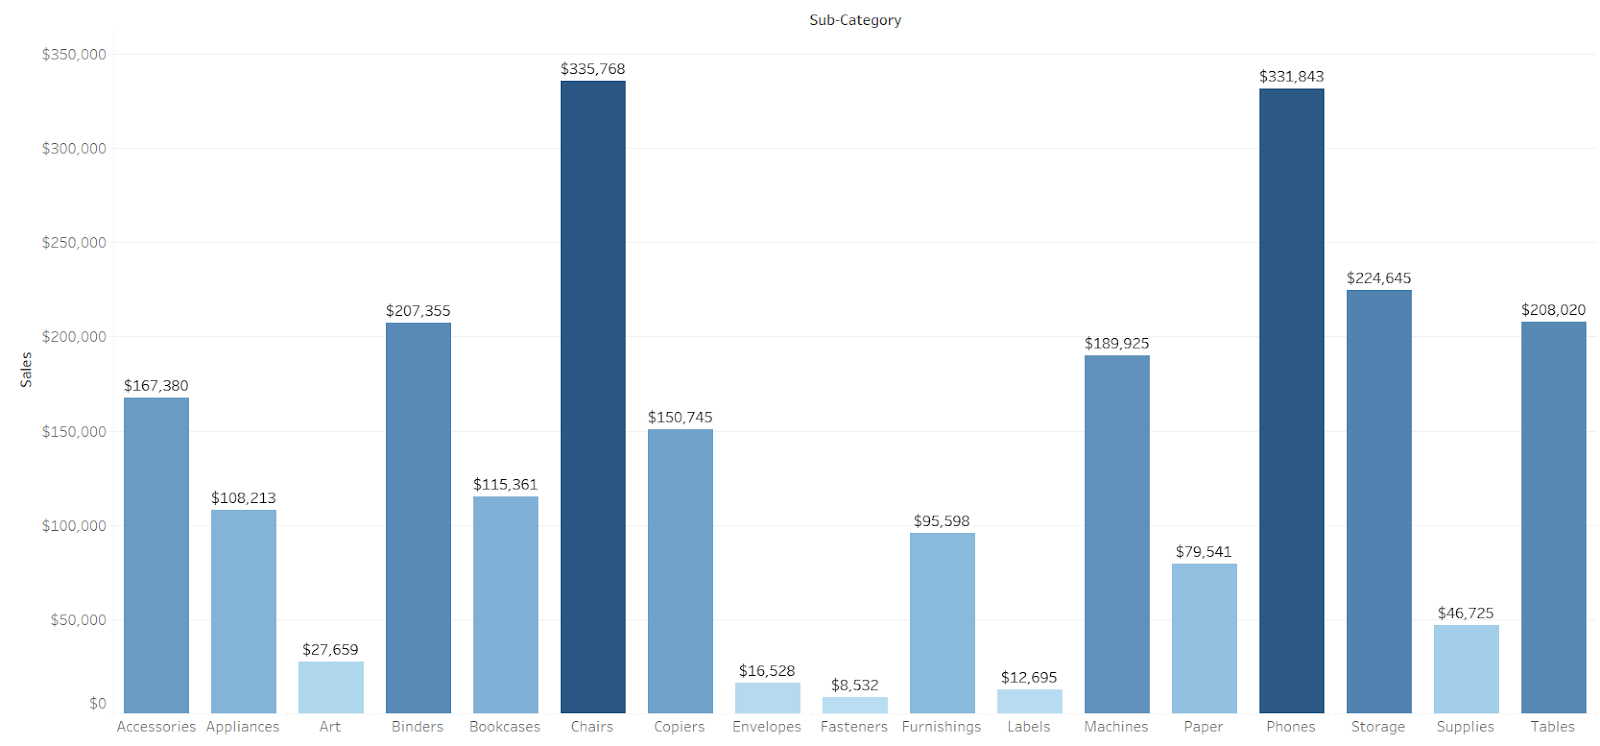
I’m guilty of making such charts, especially at the beginning of my data visualization journey. For anyone applying to the Data School, here are five easy ways to improve a bar chart:
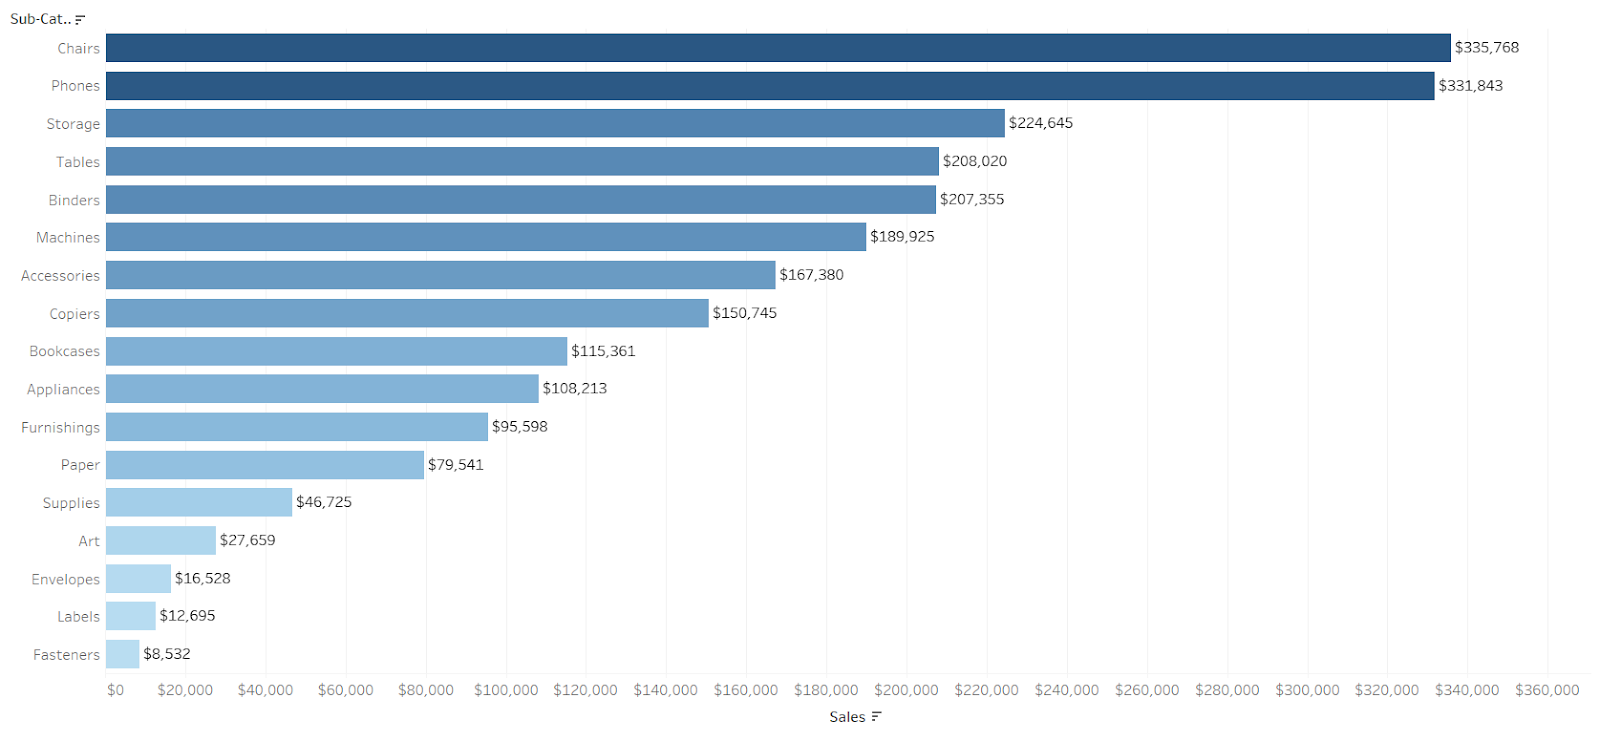
1. Sort the bars in descending or ascending order. This will draw attention to either the greatest or smallest value and in this way, help the information be immediately interpreted.
(However, there is a caveat: if the categories have a natural order, like days of the week or months of a year, keep that order instead of sorting!)


2. Rotate the chart. In a horizontal bar chart, the headers will be easier to read. This is especially effective with lengthy headers that may require a cock of the head.

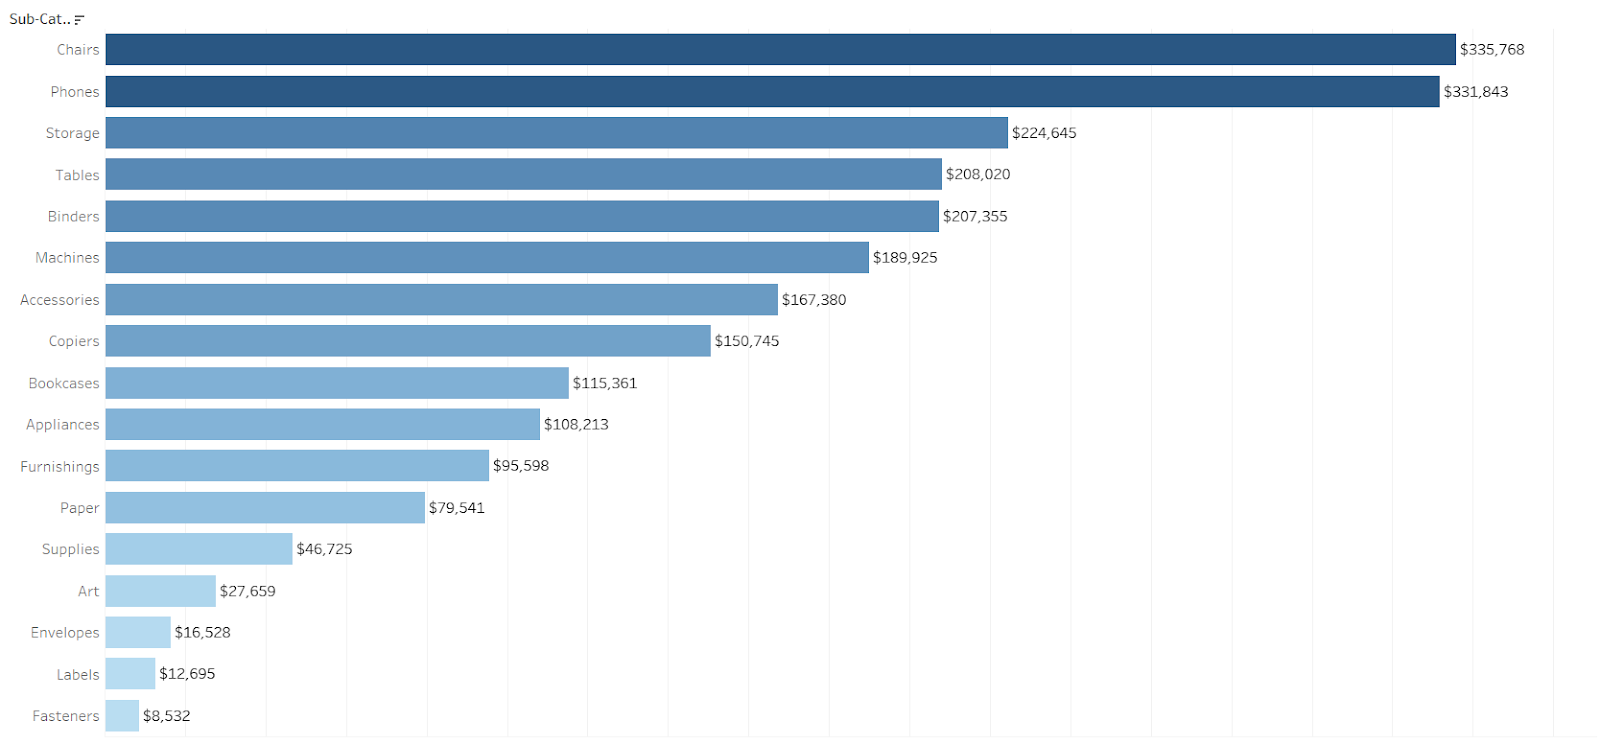
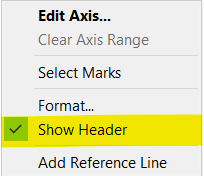
3. Avoid double-encoding. If there are both data labels and a numbered axis, choose one. My personal preference is for data labels.
To do this, right-click the axis and select “Show Header” to untick it.
4. Speaking of double-encoding, color carefully. Be mindful of how color is used - does it serve a purpose or confuse? If it’s the latter, keep your bars a single color.
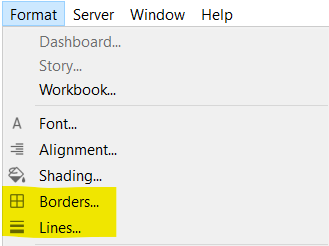
5. Remove chart junk. If gridlines, other lines, and field labels do not add value, they’re unnecessary - bye!
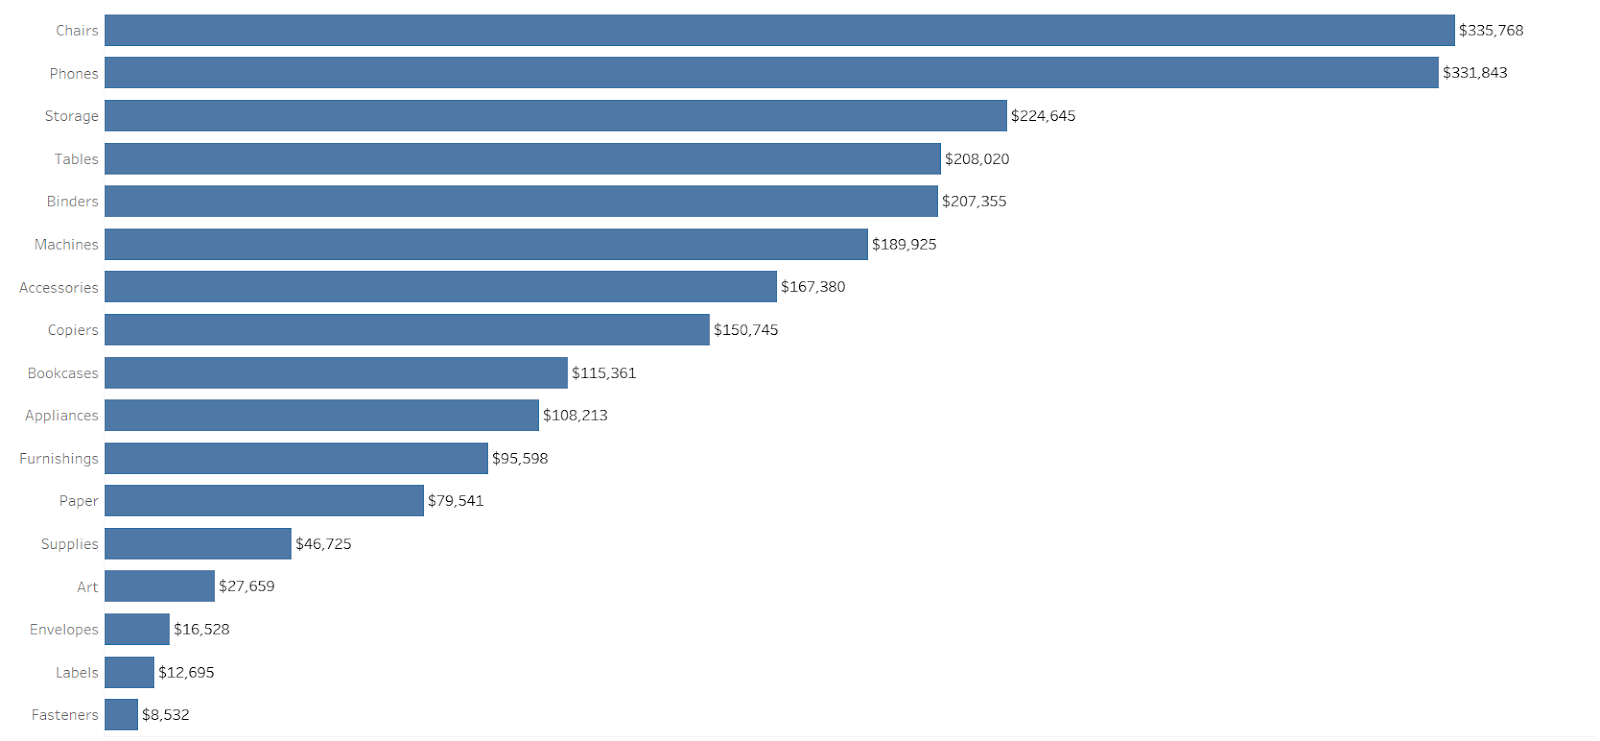
To remove borders and lines, select Format > Borders or Lines and format accordingly in the pane that appears on the left.
Maximalist me wanted to color each bar a different color and have ALL the labels, but I’m learning to be more discerning here at the Data School.